


US democracy stuck in a rut until January?
GAS
According to this week’s Reuters/Ipsos poll, 71% of Americans want Congress to pass legislation to end the war with Iran.
Put another way, of those polled, 93% of the Democrats and 51% of the Republicans support ending the war now.
And so, it’s fair to conclude that only a minority of Americans (including key members of the Trump Administration) are happy with the status quo – and yet, it would seem very unlikely that the war will end now, or in the days/weeks to come.
The Democrats don’t take the House of Representatives and the Senate until 3rd January, so between now and then, Democrats and Trump-critics will be making moves to dismantle Trump’s war/money-making machine. Unfortunately (unless you’re one of the 29% of Americans who support the war), an early effort to impeach Pete Hegseth (Secretary of War) accusing him of waging war on Iran without congressional authorisation, has failed on Capitol Hill today.
A majority of the House of Representatives voted instead to refer impeachment articles to a committee – essentially killing the effort introduced by dissident Republican congressman Thomas Massie of Kentucky. However, once the Democrats assume the majority come 3rd January, the outcome is likely to be very different – but until then, US democracy will be caught in a hiatus, and the Strait of Hormuz will no doubt remain closed.
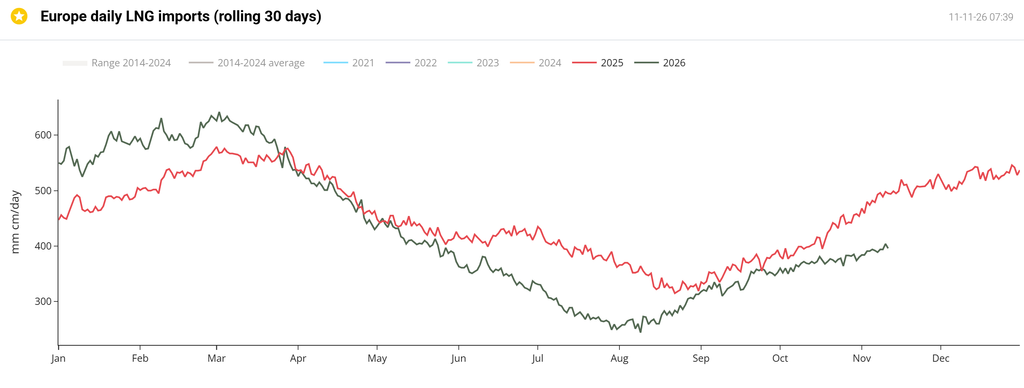
Europe’s LNG imports remain below last year’s levels:
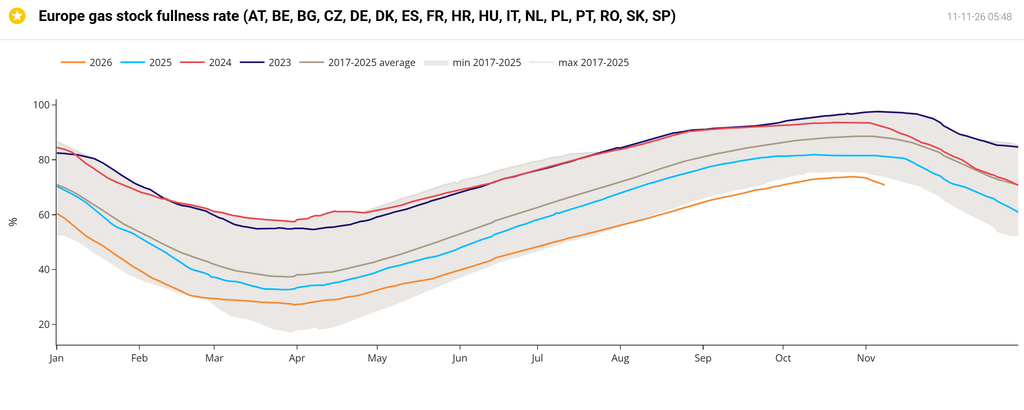
And historically low winter stockpiles caused by the closure of the Strait of Hormuz for the past 257 days, have rolled over into net withdrawal as the heating season gathers pace – aggregated fullness across Europe is at 71% versus the 8-year average of 88%:
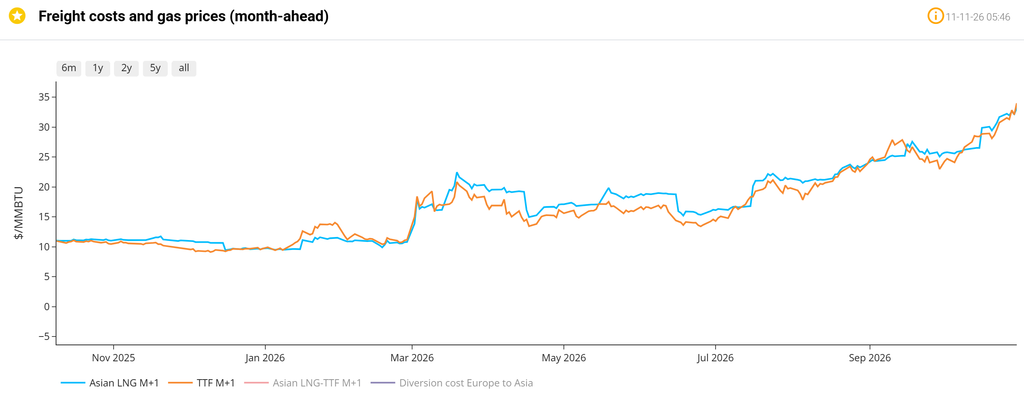
Trump’s war of choice took a fifth of global LNG exports out of circulation across the whole of Summer-26 – forcing Europe and Asia to fight over a limited pool of supply (TTF is the European gas benchmark):
Following a week of optimism and falling prices, the last couple of days have seen a bounce – most of this bounce can be attributed to last week’s sell-off losing steam (in the face of undeniably bleak fundamentals – low supply, high demand):
On the geopolitical front, US/Iran talks are going nowhere – as has been the story all year, it’s a morass of claims and denials.
Notably, trilateral talks are underway in Abu Dhabi between the US, Ukraine, and Russia, as well as the EU and NATO – if things go badly here too, we’ll likely see more risk built in to near-to-mid term delivery prices.
On a more positive note, off the back of the Democratic sweep at the mid-terms, Monthly Forwards down the curve beginning Summer-28 are down versus 1-month ago:
View as table
| Contract | Latest close (p/therm) | One month ago |
|---|---|---|
| DEC 26 | 215.94 | 205.23 |
| JAN 27 | 217.32 | 206.54 |
| FEB 27 | 215.58 | 205.18 |
| MAR 27 | 202.80 | 195.38 |
| APR 27 | 173.71 | 166.60 |
| MAY 27 | 163.10 | 155.22 |
| JUN 27 | 155.95 | 147.99 |
| JUL 27 | 153.15 | 145.04 |
| AUG 27 | 152.22 | 145.07 |
| SEP 27 | 152.42 | 143.81 |
| OCT 27 | 151.29 | 142.23 |
| NOV 27 | 152.91 | 144.85 |
| DEC 27 | 154.35 | 147.58 |
| JAN 28 | 152.77 | 146.87 |
| FEB 28 | 148.71 | 144.29 |
| MAR 28 | 138.54 | 133.64 |
| APR 28 | 99.09 | 101.10 |
| MAY 28 | 91.13 | 92.24 |
| JUN 28 | 88.86 | 89.57 |
| JUL 28 | 84.89 | 86.47 |
| AUG 28 | 85.02 | 86.40 |
| SEP 28 | 86.17 | 87.46 |
| OCT 28 | 89.59 | 92.72 |
| NOV 28 | 92.69 | 95.66 |
| DEC 28 | 94.90 | 97.95 |
| JAN 29 | 95.95 | 100.33 |
| FEB 29 | 94.89 | 98.86 |
| MAR 29 | 91.11 | 95.39 |
| APR 29 | 72.72 | 78.42 |
| MAY 29 | 68.57 | 74.06 |
| JUN 29 | 67.77 | 72.33 |
| JUL 29 | 66.27 | 71.51 |
| AUG 29 | 66.91 | 72.18 |
| SEP 29 | 68.21 | 73.51 |
| OCT 29 | 73.42 | 77.74 |
| NOV 29 | 76.30 | 80.62 |
| DEC 29 | 78.43 | 82.75 |
| JAN 30 | 79.52 | 84.04 |
| FEB 30 | 79.88 | 84.39 |
| MAR 30 | 77.38 | 82.58 |
| APR 30 | 72.38 | 73.36 |
| MAY 30 | 69.89 | 70.77 |
| JUN 30 | 67.89 | 68.39 |
| JUL 30 | 65.43 | 66.61 |
| AUG 30 | 65.04 | 66.21 |
| SEP 30 | 66.65 | 67.65 |
| OCT 30 | 73.26 | 74.16 |
| NOV 30 | 76.55 | 76.95 |
| DEC 30 | 78.49 | 78.91 |
Seasonal Forwards are down versus a week ago:
View as table
| Season | Last close (p/therm) | 1 week ago | 1 month ago | 3 months ago | 6 months ago |
|---|---|---|---|---|---|
| SUM 27 | 158.39 | 154.54 | 150.58 | 91.87 | 86.19 |
| WIN 27 | 149.76 | 148.33 | 143.22 | 91.28 | 87.06 |
| SUM 28 | 89.16 | 90.47 | 90.50 | 67.49 | 64.92 |
| WIN 28 | 93.16 | 95.98 | 96.79 | 74.89 | 71.49 |
| SUM 29 | 68.39 | 70.81 | 73.65 | 60.94 | 58.47 |
| WIN 29 | 77.45 | 80.28 | 81.98 | 70.75 | 67.22 |
| SUM 30 | 67.86 | 68.56 | 68.81 | 61.60 | 58.66 |
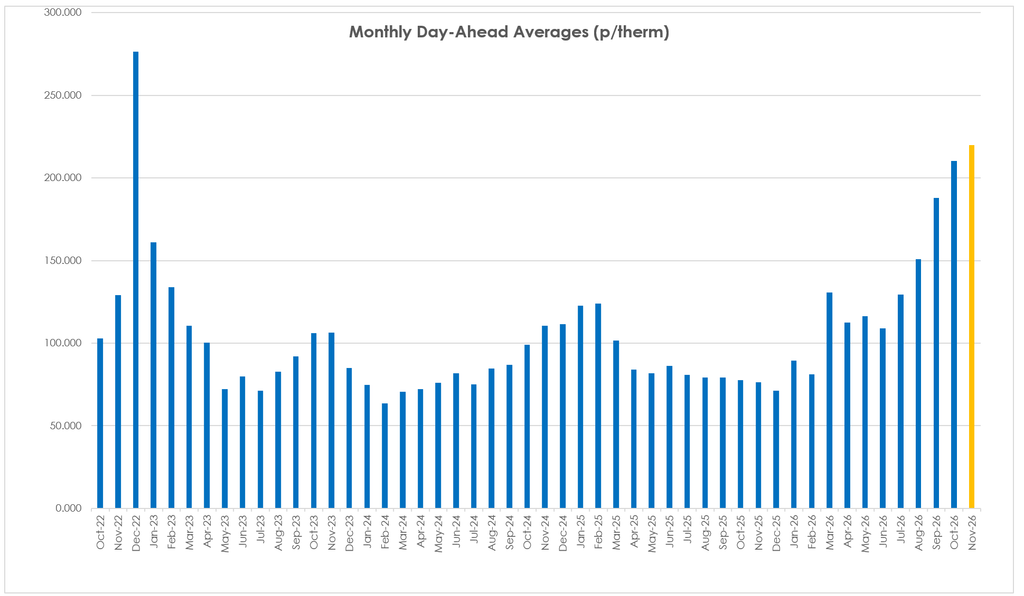
November’s Monthly Day-Ahead Average has declined to 220p/therm (or 7.5p/kwh exc non-gas):
ELECTRICITY & CARBON
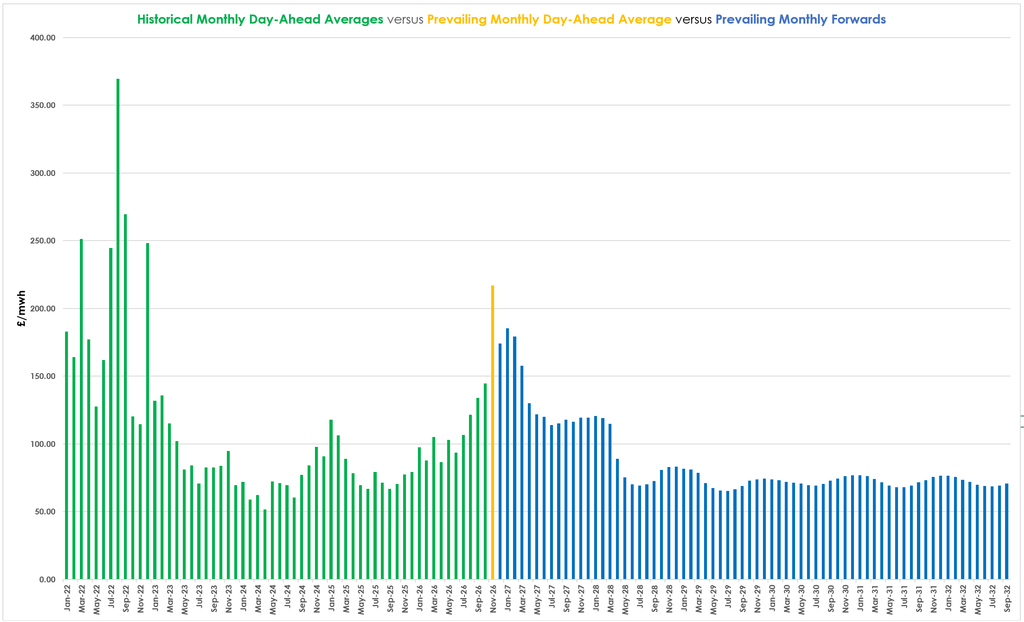
Notably (but inevitably, given worsening renewables outputs amid increasingly wintry conditions), this month’s prevailing UK electricity Monthly Day-Ahead Average is at an eye-watering premium to the rest of the winter’s Monthly Forwards (reflecting a short-term physical supply crunch versus benign expectations for the years ahead):
Nonetheless, Month-Ahead electricity remains at a discount versus gas (but only just!):
View as table
| Week ending | Gas index | Gas (p/therm) | Power index | Power (£/MWh) |
|---|---|---|---|---|
| 15 Nov 2024 | 100.0 | 116.40 | 100.0 | 95.85 |
| 22 Nov 2024 | 100.3 | 116.69 | 99.5 | 95.33 |
| 29 Nov 2024 | 100.6 | 117.09 | 100.8 | 96.60 |
| 6 Dec 2024 | 99.1 | 115.35 | 102.7 | 98.48 |
| 13 Dec 2024 | 88.3 | 102.79 | 93.2 | 89.38 |
| 20 Dec 2024 | 93.5 | 108.84 | 97.6 | 93.51 |
| 27 Dec 2024 | 102.3 | 119.06 | 107.6 | 103.18 |
| 3 Jan 2025 | 106.5 | 123.97 | 107.1 | 102.67 |
| 10 Jan 2025 | 98.0 | 114.07 | 97.1 | 93.10 |
| 17 Jan 2025 | 102.3 | 119.04 | 100.5 | 96.35 |
| 24 Jan 2025 | 107.0 | 124.51 | 110.8 | 106.18 |
| 31 Jan 2025 | 114.5 | 133.23 | 120.2 | 115.25 |
| 7 Feb 2025 | 116.4 | 135.48 | 116.3 | 111.47 |
| 14 Feb 2025 | 105.2 | 122.47 | 105.5 | 101.07 |
| 21 Feb 2025 | 94.9 | 110.51 | 96.0 | 91.99 |
| 28 Feb 2025 | 91.1 | 105.98 | 93.8 | 89.94 |
| 7 Mar 2025 | 83.0 | 96.66 | 85.1 | 81.59 |
| 14 Mar 2025 | 89.2 | 103.85 | 90.8 | 87.05 |
| 21 Mar 2025 | 88.6 | 103.13 | 93.0 | 89.10 |
| 28 Mar 2025 | 84.3 | 98.08 | 89.3 | 85.62 |
| 4 Apr 2025 | 76.0 | 88.49 | 76.2 | 73.05 |
| 11 Apr 2025 | 71.1 | 82.76 | 74.6 | 71.55 |
| 17 Apr 2025 | 74.8 | 87.01 | 78.6 | 75.32 |
| 25 Apr 2025 | 66.8 | 77.77 | 75.6 | 72.43 |
| 2 May 2025 | 68.4 | 79.63 | 77.0 | 73.80 |
| 9 May 2025 | 70.9 | 82.48 | 78.8 | 75.50 |
| 16 May 2025 | 71.7 | 83.42 | 78.7 | 75.42 |
| 23 May 2025 | 75.0 | 87.33 | 81.1 | 77.78 |
| 30 May 2025 | 69.1 | 80.38 | 74.3 | 71.22 |
| 6 Jun 2025 | 72.9 | 84.90 | 79.9 | 76.55 |
| 13 Jun 2025 | 76.7 | 89.27 | 85.2 | 81.65 |
| 20 Jun 2025 | 82.2 | 95.66 | 85.4 | 81.88 |
| 27 Jun 2025 | 65.3 | 76.05 | 74.5 | 71.40 |
| 4 Jul 2025 | 68.0 | 79.12 | 75.5 | 72.38 |
| 11 Jul 2025 | 73.4 | 85.44 | 79.2 | 75.95 |
| 18 Jul 2025 | 68.7 | 79.92 | 75.5 | 72.40 |
| 25 Jul 2025 | 67.6 | 78.65 | 76.2 | 73.05 |
| 1 Aug 2025 | 71.6 | 83.33 | 80.5 | 77.20 |
| 8 Aug 2025 | 68.0 | 79.09 | 80.6 | 77.24 |
| 15 Aug 2025 | 65.5 | 76.23 | 76.7 | 73.52 |
| 22 Aug 2025 | 71.4 | 83.14 | 81.5 | 78.08 |
| 29 Aug 2025 | 67.0 | 77.95 | 77.4 | 74.18 |
| 5 Sep 2025 | 69.4 | 80.75 | 77.7 | 74.43 |
| 12 Sep 2025 | 71.0 | 82.60 | 78.0 | 74.75 |
| 19 Sep 2025 | 70.6 | 82.18 | 79.2 | 75.95 |
| 26 Sep 2025 | 71.6 | 83.32 | 77.6 | 74.38 |
| 3 Oct 2025 | 70.3 | 81.87 | 85.3 | 81.71 |
| 10 Oct 2025 | 71.3 | 83.03 | 86.5 | 82.92 |
| 17 Oct 2025 | 70.2 | 81.75 | 86.7 | 83.12 |
| 24 Oct 2025 | 70.3 | 81.82 | 82.6 | 79.21 |
| 31 Oct 2025 | 69.5 | 80.86 | 83.2 | 79.78 |
| 7 Nov 2025 | 70.4 | 81.90 | 84.3 | 80.79 |
| 14 Nov 2025 | 71.0 | 82.65 | 86.2 | 82.58 |
| 21 Nov 2025 | 68.0 | 79.10 | 85.2 | 81.68 |
| 28 Nov 2025 | 64.6 | 75.24 | 85.8 | 82.24 |
| 5 Dec 2025 | 60.6 | 70.55 | 82.2 | 78.83 |
| 12 Dec 2025 | 62.0 | 72.22 | 85.5 | 81.93 |
| 19 Dec 2025 | 63.5 | 73.91 | 89.3 | 85.58 |
| 26 Dec 2025 | 62.9 | 73.25 | 89.0 | 85.32 |
| 2 Jan 2026 | 62.8 | 73.11 | 87.4 | 83.75 |
| 9 Jan 2026 | 60.9 | 70.84 | 86.4 | 82.83 |
| 16 Jan 2026 | 78.9 | 91.80 | 109.6 | 105.02 |
| 23 Jan 2026 | 84.4 | 98.26 | 111.2 | 106.56 |
| 30 Jan 2026 | 81.8 | 95.20 | 104.5 | 100.17 |
| 6 Feb 2026 | 70.6 | 82.18 | 86.6 | 83.00 |
| 13 Feb 2026 | 64.5 | 75.10 | 77.3 | 74.08 |
| 20 Feb 2026 | 66.0 | 76.82 | 77.1 | 73.90 |
| 27 Feb 2026 | 67.2 | 78.23 | 76.5 | 73.31 |
| 6 Mar 2026 | 115.3 | 134.17 | 106.0 | 101.63 |
| 13 Mar 2026 | 109.3 | 127.19 | 101.0 | 96.79 |
| 20 Mar 2026 | 128.8 | 149.97 | 111.0 | 106.42 |
| 27 Mar 2026 | 117.2 | 136.39 | 103.5 | 99.20 |
| 2 Apr 2026 | 108.2 | 125.95 | 100.1 | 95.90 |
| 10 Apr 2026 | 93.8 | 109.21 | 90.8 | 87.01 |
| 17 Apr 2026 | 82.6 | 96.12 | 86.0 | 82.39 |
| 24 Apr 2026 | 95.6 | 111.23 | 93.9 | 90.01 |
| 1 May 2026 | 95.4 | 111.06 | 97.0 | 92.98 |
| 8 May 2026 | 92.1 | 107.17 | 96.3 | 92.30 |
| 15 May 2026 | 105.5 | 122.82 | 107.1 | 102.62 |
| 22 May 2026 | 100.7 | 117.24 | 104.9 | 100.58 |
| 29 May 2026 | 94.7 | 110.23 | 104.0 | 99.66 |
| 5 Jun 2026 | 100.7 | 117.21 | 107.3 | 102.89 |
| 12 Jun 2026 | 96.2 | 111.95 | 103.0 | 98.70 |
| 19 Jun 2026 | 87.0 | 101.24 | 98.8 | 94.71 |
| 26 Jun 2026 | 83.9 | 97.67 | 94.8 | 90.89 |
| 3 Jul 2026 | 92.9 | 108.14 | 101.0 | 96.76 |
| 10 Jul 2026 | 100.3 | 116.74 | 106.6 | 102.20 |
| 17 Jul 2026 | 119.8 | 139.42 | 120.4 | 115.38 |
| 24 Jul 2026 | 130.6 | 152.04 | 132.7 | 127.18 |
| 31 Jul 2026 | 121.6 | 141.54 | 126.0 | 120.78 |
| 7 Aug 2026 | 116.9 | 136.12 | 120.8 | 115.74 |
| 14 Aug 2026 | 128.4 | 149.40 | 129.0 | 123.62 |
| 21 Aug 2026 | 140.4 | 163.46 | 134.2 | 128.68 |
| 28 Aug 2026 | 139.5 | 162.38 | 136.0 | 130.34 |
| 4 Sep 2026 | 153.7 | 178.90 | 145.9 | 139.89 |
| 11 Sep 2026 | 171.1 | 199.17 | 159.9 | 153.22 |
| 18 Sep 2026 | 169.1 | 196.86 | 160.0 | 153.34 |
| 25 Sep 2026 | 153.3 | 178.49 | 148.2 | 142.05 |
| 2 Oct 2026 | 162.4 | 189.01 | 160.1 | 153.49 |
| 9 Oct 2026 | 174.4 | 202.98 | 169.6 | 162.52 |
| 16 Oct 2026 | 186.4 | 216.98 | 176.8 | 169.45 |
| 23 Oct 2026 | 196.1 | 228.31 | 188.2 | 180.37 |
| 30 Oct 2026 | 220.0 | 256.06 | 209.5 | 200.76 |
| 6 Nov 2026 | 183.2 | 213.22 | 181.6 | 174.02 |
| 11 Nov 2026 | 185.4 | 215.82 | 190.3 | 182.38 |
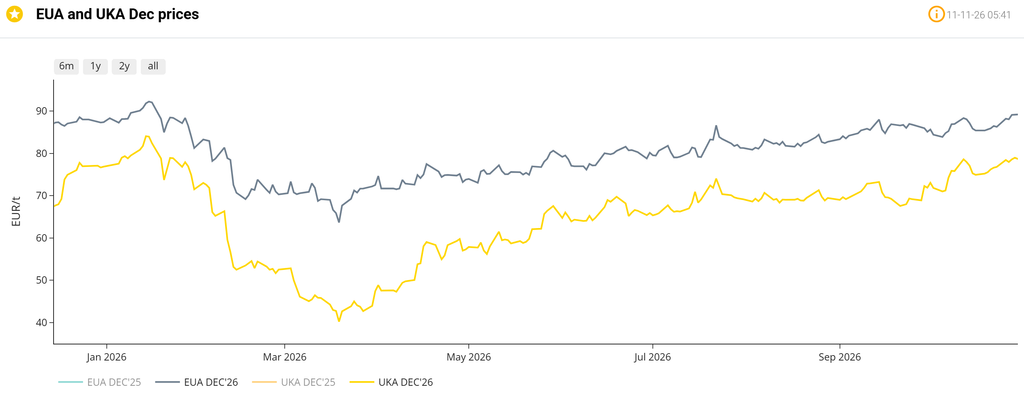
On the Carbon side of things, mid-price Dec-26 UKA delivery sits at at £67.20/tn (and the spot is at mid 66s) – with UK CBAM imminent for Jan ’27, EUA/UKA linkage looks nailed-on (which means, as the more thinly traded cousin, UKAs are rising to parity):