


Trump says US does not need Iran deal (instead, he’s asked Vance to focus on alleged fraud in Democratic-run cities and states)
GAS
Trump is at it again on social media:
“We don’t need a deal with Iran. Those days have long since passed. We’ve got their money, Hundreds of Billions of Dollars, and we’ve got their Strait!” (sic)
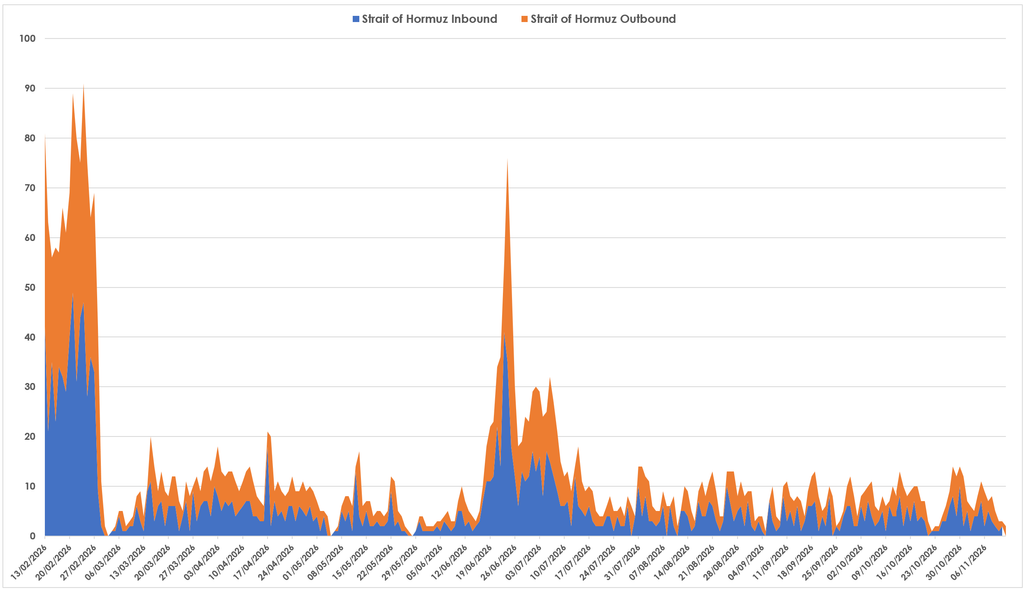
For global commodity markets, it’s going ot be a long 52-days until the Democrats assume congressional majority on 3rd January – transits through the Strait of Hormuz are back on the floor this week:
Despite the early optimism following the mid-terms, European/UK gas prices rose for a third consecutive session yesterday, with benchmark European TTF futures gaining as much as 3.5%:
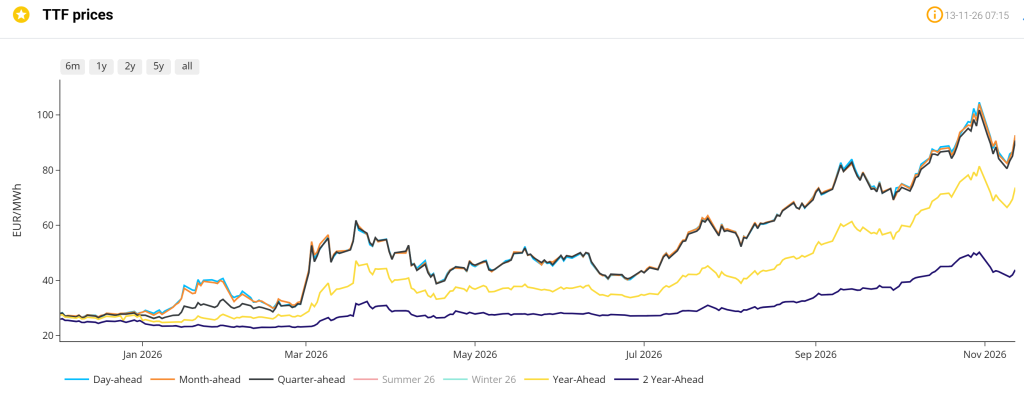
On top of the closure of the Strait of Hormuz, burgeoning wintry conditions, hastening storage withdrawals, and unscheduled Norwegian pipeline outages are supporting prices.
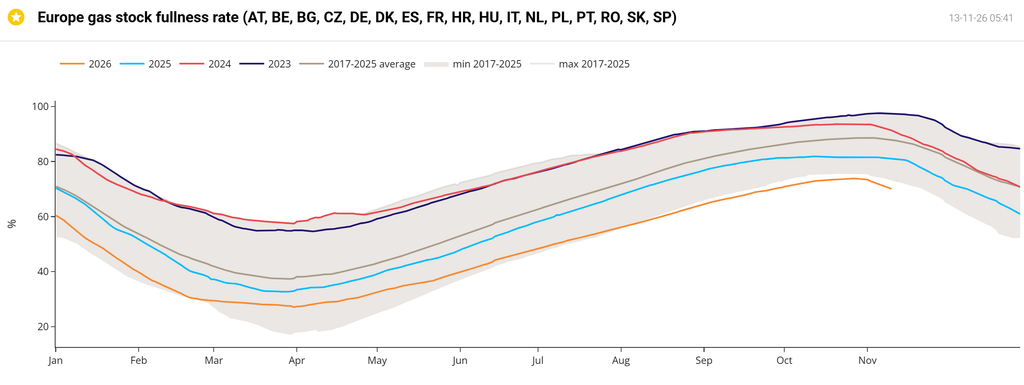
Aggregated European storage fullness is at 70% versus the 8-year average of 88%:
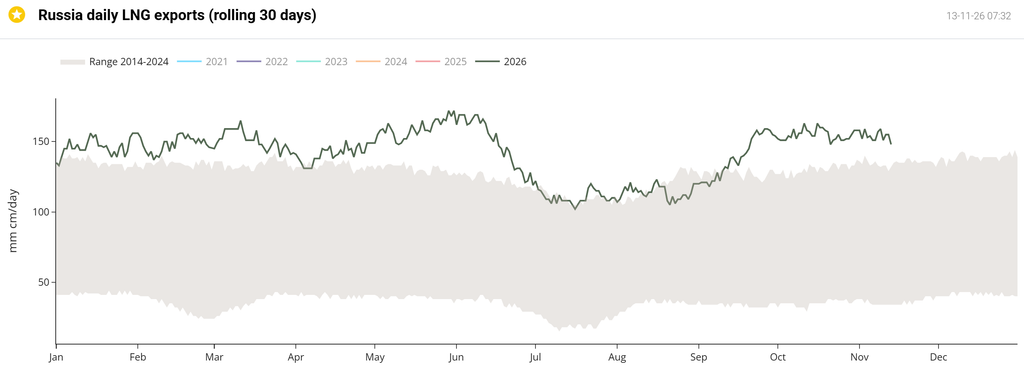
Notably, the EU paid approximately €8.7 billion for LNG from Russia’s Yamal project during the first ten months of the year. Whilst October volumes fell more than 10% month on month to 705,591 tonnes, higher prices actually increased payments by 2.6% – so Russia is earning more for supplying less. The EU continues to purchase almost half of Russia’s LNG exports ahead of a full ban on Russian gas imports in January – not the best timing!:
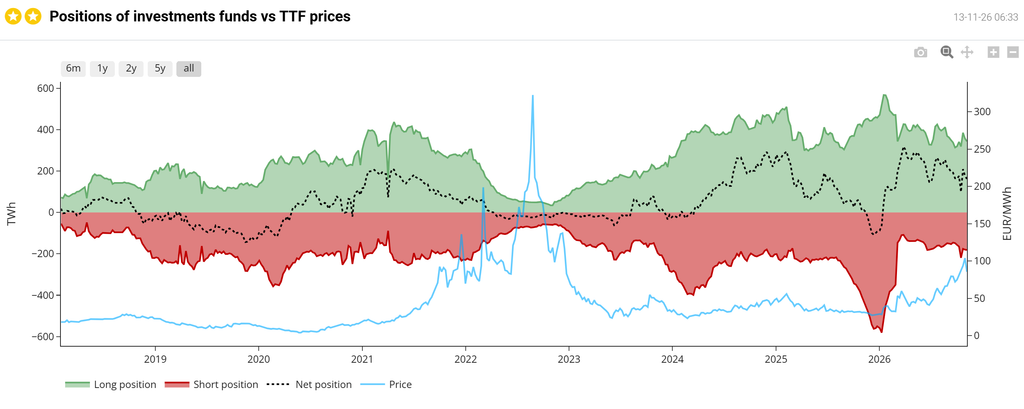
Whilst investment funds have again this week scaled down their net long position, like other participants, speculators remain acutely aware that a rebound in prices (should Trump remain incalcitrant) remains a danger:
Seasonal Forwards (primarily the front 2-Seasons) are up again on the week/month/3-months/6-months:
View as table
| Season | Last close (p/therm) | 1 week ago | 1 month ago | 3 months ago | 6 months ago |
|---|---|---|---|---|---|
| SUM 27 | 162.64 | 158.22 | 157.36 | 95.84 | 86.31 |
| WIN 27 | 151.80 | 151.24 | 149.60 | 93.89 | 87.13 |
| SUM 28 | 89.52 | 92.50 | 92.85 | 69.12 | 65.05 |
| WIN 28 | 93.00 | 97.40 | 98.26 | 76.63 | 71.99 |
| SUM 29 | 68.54 | 70.49 | 75.28 | 61.67 | 58.76 |
| WIN 29 | 77.69 | 79.46 | 83.70 | 71.21 | 67.30 |
| SUM 30 | 68.18 | 67.74 | 69.88 | 63.10 | 58.75 |
Though Monthly Forwards beginning Winter-28 remain marginally lower compared to 1-month ago:
View as table
| Contract | Latest close (p/therm) | One month ago |
|---|---|---|
| DEC 26 | 226.11 | 219.31 |
| JAN 27 | 226.76 | 220.65 |
| FEB 27 | 224.62 | 218.95 |
| MAR 27 | 211.35 | 208.10 |
| APR 27 | 180.68 | 175.90 |
| MAY 27 | 167.28 | 162.38 |
| JUN 27 | 160.03 | 154.69 |
| JUL 27 | 156.88 | 150.70 |
| AUG 27 | 155.79 | 150.87 |
| SEP 27 | 155.48 | 149.89 |
| OCT 27 | 153.26 | 148.78 |
| NOV 27 | 154.79 | 151.24 |
| DEC 27 | 155.87 | 154.22 |
| JAN 28 | 155.12 | 153.19 |
| FEB 28 | 151.11 | 150.59 |
| MAR 28 | 140.72 | 139.72 |
| APR 28 | 100.61 | 103.91 |
| MAY 28 | 91.94 | 94.77 |
| JUN 28 | 89.36 | 92.09 |
| JUL 28 | 84.94 | 88.55 |
| AUG 28 | 84.72 | 88.49 |
| SEP 28 | 85.81 | 89.55 |
| OCT 28 | 89.61 | 94.39 |
| NOV 28 | 92.72 | 97.28 |
| DEC 28 | 94.84 | 99.50 |
| JAN 29 | 95.67 | 101.61 |
| FEB 29 | 94.52 | 100.14 |
| MAR 29 | 90.83 | 96.81 |
| APR 29 | 72.91 | 79.86 |
| MAY 29 | 68.76 | 75.67 |
| JUN 29 | 67.81 | 74.03 |
| JUL 29 | 66.38 | 73.24 |
| AUG 29 | 67.02 | 73.94 |
| SEP 29 | 68.45 | 75.08 |
| OCT 29 | 73.64 | 79.56 |
| NOV 29 | 76.56 | 82.37 |
| DEC 29 | 78.65 | 84.49 |
| JAN 30 | 79.76 | 85.75 |
| FEB 30 | 80.12 | 86.10 |
| MAR 30 | 77.63 | 84.16 |
| APR 30 | 72.70 | 74.49 |
| MAY 30 | 70.21 | 71.90 |
| JUN 30 | 68.20 | 69.51 |
| JUL 30 | 65.75 | 67.63 |
| AUG 30 | 65.35 | 67.22 |
| SEP 30 | 66.96 | 68.66 |
| OCT 30 | 74.03 | 75.64 |
| NOV 30 | 77.32 | 78.44 |
| DEC 30 | 79.27 | 80.40 |
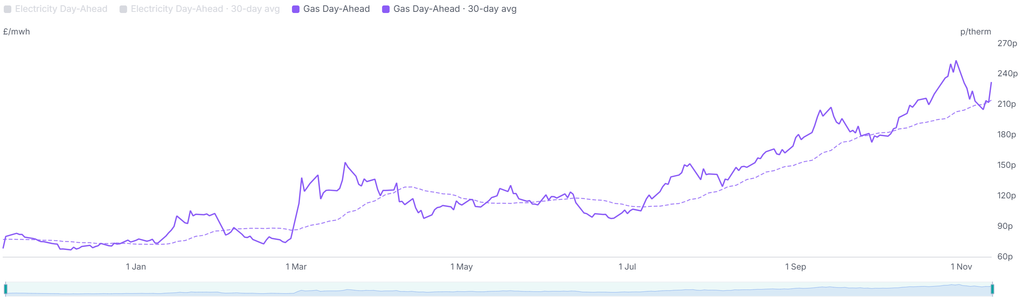
Monthly Day-Ahead Averages for November so far are at 221p/therm (or 7.5p/kwh exc non-gas):
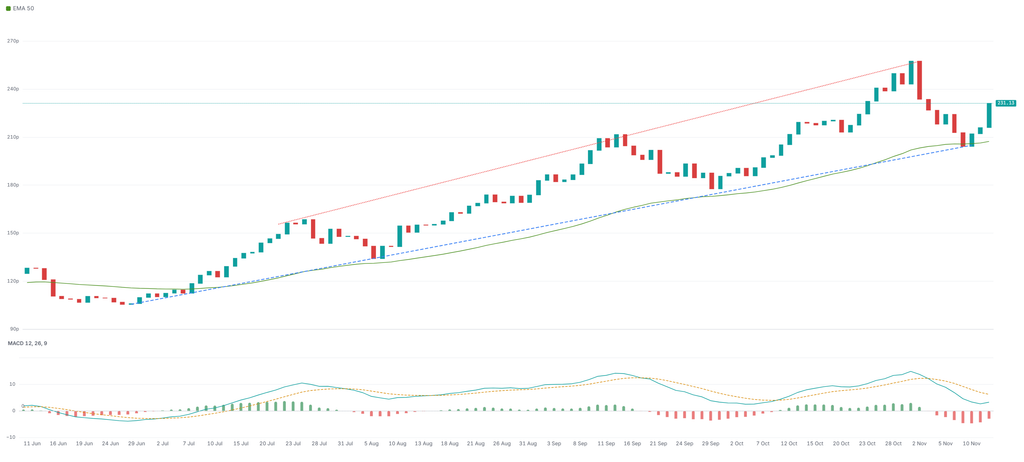
Month-Ahead UK gas prices remain bound by an ascending price channel (and the 50-period exponential moving average), though momentum indicators are increasingly divergent (reflecting a slowing in the bullish trend):
ELECTRICITY & CARBON
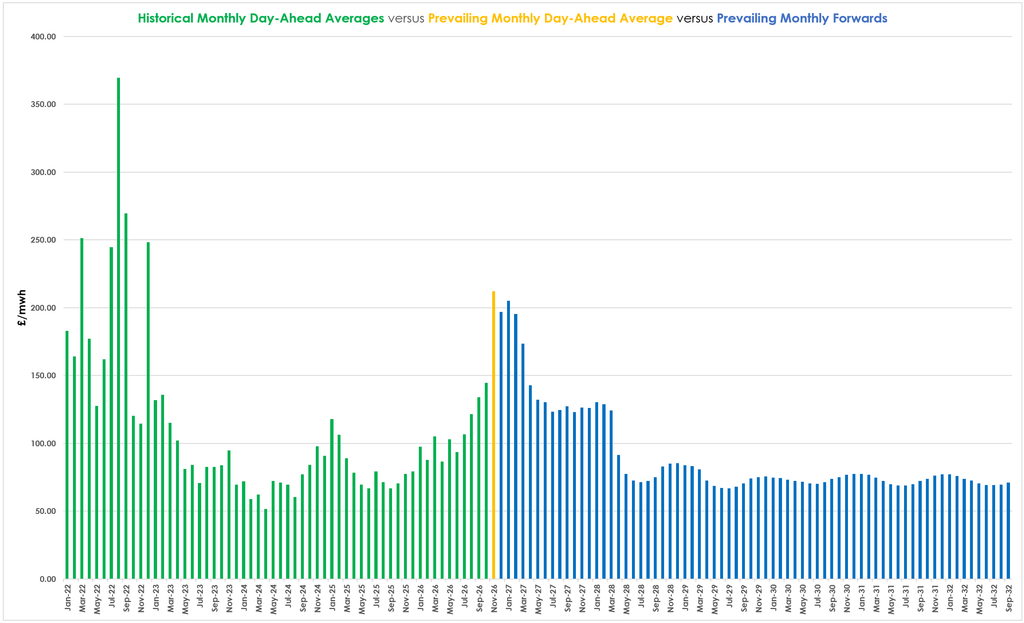
Notably (but inevitably, given worsening renewables outputs amid increasingly wintry conditions), this month’s prevailing UK electricity Monthly Day-Ahead Average remains at a premium to the rest of the winter’s Monthly Forwards (reflecting a short-term physical supply crunch versus benign expectations for the years ahead). Monthly Day-Ahead Averages for November so far are at £121/mwh (or 21.2p/kwh exc non-energy):
Nonetheless, Month-Ahead electricity remains at a discount versus gas (but only just!):
View as table
| Week ending | Gas index | Gas (p/therm) | Power index | Power (£/MWh) |
|---|---|---|---|---|
| 15 Nov 2024 | 100.0 | 116.40 | 100.0 | 95.85 |
| 22 Nov 2024 | 100.3 | 116.69 | 99.5 | 95.33 |
| 29 Nov 2024 | 100.6 | 117.09 | 100.8 | 96.60 |
| 6 Dec 2024 | 99.1 | 115.35 | 102.7 | 98.48 |
| 13 Dec 2024 | 88.3 | 102.79 | 93.2 | 89.38 |
| 20 Dec 2024 | 93.5 | 108.84 | 97.6 | 93.51 |
| 27 Dec 2024 | 102.3 | 119.06 | 107.6 | 103.18 |
| 3 Jan 2025 | 106.5 | 123.97 | 107.1 | 102.67 |
| 10 Jan 2025 | 98.0 | 114.07 | 97.1 | 93.10 |
| 17 Jan 2025 | 102.3 | 119.04 | 100.5 | 96.35 |
| 24 Jan 2025 | 107.0 | 124.51 | 110.8 | 106.18 |
| 31 Jan 2025 | 114.5 | 133.23 | 120.2 | 115.25 |
| 7 Feb 2025 | 116.4 | 135.48 | 116.3 | 111.47 |
| 14 Feb 2025 | 105.2 | 122.47 | 105.5 | 101.07 |
| 21 Feb 2025 | 94.9 | 110.51 | 96.0 | 91.99 |
| 28 Feb 2025 | 91.1 | 105.98 | 93.8 | 89.94 |
| 7 Mar 2025 | 83.0 | 96.66 | 85.1 | 81.59 |
| 14 Mar 2025 | 89.2 | 103.85 | 90.8 | 87.05 |
| 21 Mar 2025 | 88.6 | 103.13 | 93.0 | 89.10 |
| 28 Mar 2025 | 84.3 | 98.08 | 89.3 | 85.62 |
| 4 Apr 2025 | 76.0 | 88.49 | 76.2 | 73.05 |
| 11 Apr 2025 | 71.1 | 82.76 | 74.6 | 71.55 |
| 17 Apr 2025 | 74.8 | 87.01 | 78.6 | 75.32 |
| 25 Apr 2025 | 66.8 | 77.77 | 75.6 | 72.43 |
| 2 May 2025 | 68.4 | 79.63 | 77.0 | 73.80 |
| 9 May 2025 | 70.9 | 82.48 | 78.8 | 75.50 |
| 16 May 2025 | 71.7 | 83.42 | 78.7 | 75.42 |
| 23 May 2025 | 75.0 | 87.33 | 81.1 | 77.78 |
| 30 May 2025 | 69.1 | 80.38 | 74.3 | 71.22 |
| 6 Jun 2025 | 72.9 | 84.90 | 79.9 | 76.55 |
| 13 Jun 2025 | 76.7 | 89.27 | 85.2 | 81.65 |
| 20 Jun 2025 | 82.2 | 95.66 | 85.4 | 81.88 |
| 27 Jun 2025 | 65.3 | 76.05 | 74.5 | 71.40 |
| 4 Jul 2025 | 68.0 | 79.12 | 75.5 | 72.38 |
| 11 Jul 2025 | 73.4 | 85.44 | 79.2 | 75.95 |
| 18 Jul 2025 | 68.7 | 79.92 | 75.5 | 72.40 |
| 25 Jul 2025 | 67.6 | 78.65 | 76.2 | 73.05 |
| 1 Aug 2025 | 71.6 | 83.33 | 80.5 | 77.20 |
| 8 Aug 2025 | 68.0 | 79.09 | 80.6 | 77.24 |
| 15 Aug 2025 | 65.5 | 76.23 | 76.7 | 73.52 |
| 22 Aug 2025 | 71.4 | 83.14 | 81.5 | 78.08 |
| 29 Aug 2025 | 67.0 | 77.95 | 77.4 | 74.18 |
| 5 Sep 2025 | 69.4 | 80.75 | 77.7 | 74.43 |
| 12 Sep 2025 | 71.0 | 82.60 | 78.0 | 74.75 |
| 19 Sep 2025 | 70.6 | 82.18 | 79.2 | 75.95 |
| 26 Sep 2025 | 71.6 | 83.32 | 77.6 | 74.38 |
| 3 Oct 2025 | 70.3 | 81.87 | 85.3 | 81.71 |
| 10 Oct 2025 | 71.3 | 83.03 | 86.5 | 82.92 |
| 17 Oct 2025 | 70.2 | 81.75 | 86.7 | 83.12 |
| 24 Oct 2025 | 70.3 | 81.82 | 82.6 | 79.21 |
| 31 Oct 2025 | 69.5 | 80.86 | 83.2 | 79.78 |
| 7 Nov 2025 | 70.4 | 81.90 | 84.3 | 80.79 |
| 14 Nov 2025 | 71.0 | 82.65 | 86.2 | 82.58 |
| 21 Nov 2025 | 68.0 | 79.10 | 85.2 | 81.68 |
| 28 Nov 2025 | 64.6 | 75.24 | 85.8 | 82.24 |
| 5 Dec 2025 | 60.6 | 70.55 | 82.2 | 78.83 |
| 12 Dec 2025 | 62.0 | 72.22 | 85.5 | 81.93 |
| 19 Dec 2025 | 63.5 | 73.91 | 89.3 | 85.58 |
| 26 Dec 2025 | 62.9 | 73.25 | 89.0 | 85.32 |
| 2 Jan 2026 | 62.8 | 73.11 | 87.4 | 83.75 |
| 9 Jan 2026 | 60.9 | 70.84 | 86.4 | 82.83 |
| 16 Jan 2026 | 78.9 | 91.80 | 109.6 | 105.02 |
| 23 Jan 2026 | 84.4 | 98.26 | 111.2 | 106.56 |
| 30 Jan 2026 | 81.8 | 95.20 | 104.5 | 100.17 |
| 6 Feb 2026 | 70.6 | 82.18 | 86.6 | 83.00 |
| 13 Feb 2026 | 64.5 | 75.10 | 77.3 | 74.08 |
| 20 Feb 2026 | 66.0 | 76.82 | 77.1 | 73.90 |
| 27 Feb 2026 | 67.2 | 78.23 | 76.5 | 73.31 |
| 6 Mar 2026 | 115.3 | 134.17 | 106.0 | 101.63 |
| 13 Mar 2026 | 109.3 | 127.19 | 101.0 | 96.79 |
| 20 Mar 2026 | 128.8 | 149.97 | 111.0 | 106.42 |
| 27 Mar 2026 | 117.2 | 136.39 | 103.5 | 99.20 |
| 2 Apr 2026 | 108.2 | 125.95 | 100.1 | 95.90 |
| 10 Apr 2026 | 93.8 | 109.21 | 90.8 | 87.01 |
| 17 Apr 2026 | 82.6 | 96.12 | 86.0 | 82.39 |
| 24 Apr 2026 | 95.6 | 111.23 | 93.9 | 90.01 |
| 1 May 2026 | 95.4 | 111.06 | 97.0 | 92.98 |
| 8 May 2026 | 92.1 | 107.17 | 96.3 | 92.30 |
| 15 May 2026 | 105.5 | 122.82 | 107.1 | 102.62 |
| 22 May 2026 | 100.7 | 117.24 | 104.9 | 100.58 |
| 29 May 2026 | 94.7 | 110.23 | 104.0 | 99.66 |
| 5 Jun 2026 | 100.7 | 117.21 | 107.3 | 102.89 |
| 12 Jun 2026 | 96.2 | 111.95 | 103.0 | 98.70 |
| 19 Jun 2026 | 87.0 | 101.24 | 98.8 | 94.71 |
| 26 Jun 2026 | 83.9 | 97.67 | 94.8 | 90.89 |
| 3 Jul 2026 | 92.9 | 108.14 | 101.0 | 96.76 |
| 10 Jul 2026 | 100.3 | 116.74 | 106.6 | 102.20 |
| 17 Jul 2026 | 119.8 | 139.42 | 120.4 | 115.38 |
| 24 Jul 2026 | 130.6 | 152.04 | 132.7 | 127.18 |
| 31 Jul 2026 | 121.6 | 141.54 | 126.0 | 120.78 |
| 7 Aug 2026 | 116.9 | 136.12 | 120.8 | 115.74 |
| 14 Aug 2026 | 128.4 | 149.40 | 129.0 | 123.62 |
| 21 Aug 2026 | 140.4 | 163.46 | 134.2 | 128.68 |
| 28 Aug 2026 | 139.5 | 162.38 | 136.0 | 130.34 |
| 4 Sep 2026 | 153.7 | 178.90 | 145.9 | 139.89 |
| 11 Sep 2026 | 171.1 | 199.17 | 159.9 | 153.22 |
| 18 Sep 2026 | 169.1 | 196.86 | 160.0 | 153.34 |
| 25 Sep 2026 | 153.3 | 178.49 | 148.2 | 142.05 |
| 2 Oct 2026 | 162.4 | 189.01 | 160.1 | 153.49 |
| 9 Oct 2026 | 174.4 | 202.98 | 169.6 | 162.52 |
| 16 Oct 2026 | 186.4 | 216.98 | 176.8 | 169.45 |
| 23 Oct 2026 | 196.1 | 228.31 | 188.2 | 180.37 |
| 30 Oct 2026 | 220.0 | 256.06 | 209.5 | 200.76 |
| 6 Nov 2026 | 183.2 | 213.22 | 181.6 | 174.02 |
| 13 Nov 2026 | 193.8 | 225.60 | 196.9 | 188.71 |
Seasonal Forwards (primarily the front 2-Seasons) are up again on the week/month/3-months/6-months:
View as table
| Season | Last close (£/MWh) | 1 week ago | 1 month ago | 3 months ago | 6 months ago |
|---|---|---|---|---|---|
| SUM 27 | 126.65 | 122.72 | 123.37 | 83.14 | 75.63 |
| WIN 27 | 123.26 | 120.82 | 122.73 | 85.63 | 79.21 |
| SUM 28 | 74.56 | 76.84 | 79.76 | 64.61 | 60.92 |
| WIN 28 | 81.29 | 83.76 | 85.32 | 72.56 | 69.45 |
| SUM 29 | 66.88 | 68.54 | 72.96 | 62.57 | 61.22 |
| WIN 29 | 73.17 | 75.03 | 80.03 | 71.58 | 68.66 |
| SUM 30 | 70.15 | 70.82 | 71.89 | 63.89 | 62.61 |
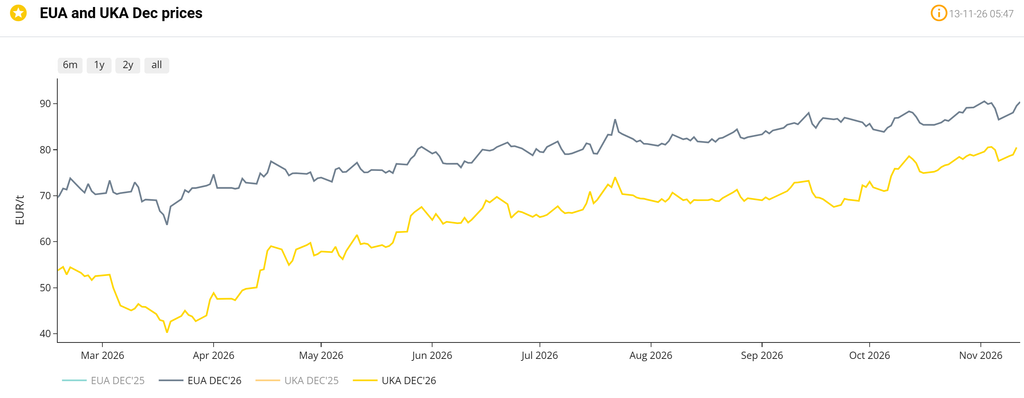
On the Carbon side of things, mid-price Dec-26 UKA delivery sits at at £67.20/tn (and the spot is at mid 66s) – with UK CBAM imminent for Jan ’27, EUA/UKA linkage looks nailed-on (which means, as the more thinly traded cousin, UKAs are rising to parity):