


The beginning of the end for Trump?
GAS
Following the Democrat’s emphatic sweep at the mid-terms earlier this week, Seasonal Forwards have declined up to 18%, front to back:
Evidently, market participants believe that the shift in power is likely to accelerate the end of the US-Israeli war against Iran (and the Strait of Hormuz will re-open accordingly).
For the first time since March, the prevailing Monthly Day-Ahead Average is more expensive than the winter’s Monthly Forwards (reflecting a drop in short-to-mid term risk premium):
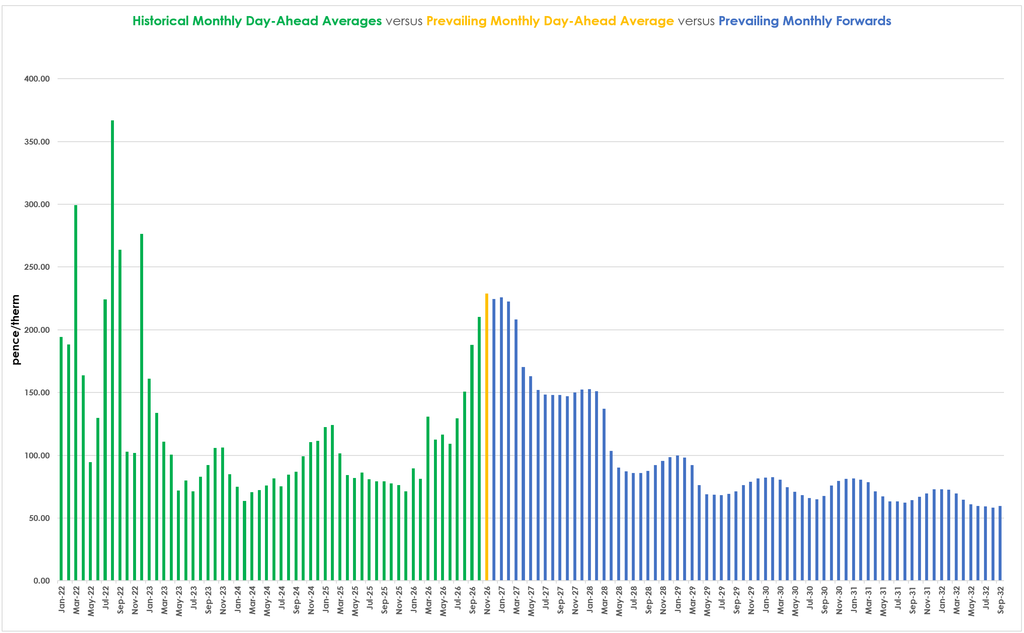
Monthly Forwards beginning Summer-28 are pretty much back to where they were a month ago:
View as table
| Contract | Latest close (p/therm) | One month ago |
|---|---|---|
| DEC 26 | 224.24 | 185.74 |
| JAN 27 | 225.60 | 187.28 |
| FEB 27 | 223.53 | 185.79 |
| MAR 27 | 208.96 | 176.76 |
| APR 27 | 176.81 | 152.67 |
| MAY 27 | 166.03 | 140.94 |
| JUN 27 | 157.90 | 133.99 |
| JUL 27 | 155.21 | 132.20 |
| AUG 27 | 154.31 | 133.00 |
| SEP 27 | 154.73 | 131.57 |
| OCT 27 | 153.64 | 131.19 |
| NOV 27 | 155.50 | 133.77 |
| DEC 27 | 157.15 | 136.60 |
| JAN 28 | 156.48 | 136.38 |
| FEB 28 | 152.55 | 133.93 |
| MAR 28 | 142.45 | 123.59 |
| APR 28 | 102.55 | 96.91 |
| MAY 28 | 94.36 | 89.15 |
| JUN 28 | 92.08 | 86.41 |
| JUL 28 | 88.71 | 83.66 |
| AUG 28 | 88.96 | 83.59 |
| SEP 28 | 90.11 | 84.77 |
| OCT 28 | 94.14 | 90.14 |
| NOV 28 | 97.25 | 93.06 |
| DEC 28 | 99.34 | 95.36 |
| JAN 29 | 100.35 | 97.67 |
| FEB 29 | 99.11 | 96.21 |
| MAR 29 | 95.20 | 92.86 |
| APR 29 | 75.00 | 77.88 |
| MAY 29 | 70.56 | 73.75 |
| JUN 29 | 69.76 | 72.01 |
| JUL 29 | 68.52 | 71.13 |
| AUG 29 | 69.17 | 71.79 |
| SEP 29 | 70.45 | 73.05 |
| OCT 29 | 75.66 | 78.59 |
| NOV 29 | 78.54 | 81.39 |
| DEC 29 | 80.67 | 83.51 |
| JAN 30 | 81.81 | 84.79 |
| FEB 30 | 82.15 | 85.14 |
| MAR 30 | 79.78 | 83.33 |
| APR 30 | 72.75 | 74.14 |
| MAY 30 | 70.11 | 71.57 |
| JUN 30 | 68.11 | 69.19 |
| JUL 30 | 65.08 | 67.41 |
| AUG 30 | 64.69 | 67.01 |
| SEP 30 | 66.30 | 68.44 |
| OCT 30 | 73.77 | 75.06 |
| NOV 30 | 77.05 | 77.85 |
| DEC 30 | 78.99 | 79.81 |
And for the first time since July, Seasonal Forwards are down all the way out versus 1-week ago:
View as table
| Season | Last close (p/therm) | 1 week ago | 1 month ago | 3 months ago | 6 months ago |
|---|---|---|---|---|---|
| SUM 27 | 160.79 | 177.10 | 137.36 | 86.85 | 87.23 |
| WIN 27 | 152.95 | 169.39 | 132.55 | 86.88 | 88.27 |
| SUM 28 | 92.76 | 107.20 | 87.38 | 65.12 | 64.84 |
| WIN 28 | 97.54 | 110.72 | 94.19 | 72.79 | 71.50 |
| SUM 29 | 70.56 | 82.23 | 73.25 | 59.63 | 59.25 |
| WIN 29 | 79.74 | 90.59 | 82.76 | 69.72 | 67.59 |
| SUM 30 | 67.82 | 73.74 | 69.61 | 60.56 | 59.45 |
So, whilst the fundamental bullish drivers remain unchanged (low European gas storage, fierce competition for LNG cargoes, increasingly wintry conditions), market sentiment has shifted from fear to optimism amid talk that Trump’s days are numbered.
Certainly, his ability to push legislation through has all but evaporated, and speculation over potential impeachment will no doubt be giving the Administration cause for concern. For his part, Trump has conceded defeat without contest admitting that the Iran conflict has been his undoing, whilst reiterating (somewhat weakly) that it was worth it. Not surprisingly, his hitherto allies are looking to distance themselves from Trump’s increasingly toxic brand, with vice president JD Vance and Texas senator Ted Cruz openly blaming the war and trade tariffs respectively.
The Democrats will take control of the House of Representatives and the Senate in January, and have pledged to tackle the cost of living whilst keeping Trump in check.
But, let’s face it, the cost of living is higher because of the impact of Trump’s foreign policy – a war of choice which as crippled global commodity supply, and trade tariffs which have inevitably resulted in higher inflation, higher interest rates, higher bond yields.
And so, for the Democrats to mend the trail of destruction Trump has left in his wake, the Strait of Hormuz will need to re-open, and a balanced approach to trade tariffs will need to be imposed. The consensus amongst analysts is that Trump will only play ball if the Democrats are able to apply sufficient pressure through a round of congressional investigations into his alleged self-enrichment by corrupt means. For now, Trump seems content to show reporters around the new ballroom at the White House, and espouse the importance of the health of the lawns around the Lincoln Memorial Reflecting Pool.
What is clear is that the US electorate have used the mid-terms to express their dissatisfaction with Trump, and his Administration’s world-view. So, whilst Trump will no doubt go to great lengths to frustrate the Democrat’s efforts to put his fires out, he will likely find it much harder to ignore the American people.
So what happens next?
Well, Trump faces a few stark choices in the short term – concede to a less favourable US-Iran peace deal, or take further military action, or do nothing. A draft memorandum of understanding, apparently approved by the US, has been presented to Iran this week, with both sides reportedly having made concessions regarding Tehran’s nuclear programme. In short order, Iran has already exempted vessels from India, China, Iraq and Qatar from restrictions on transit through the Strait of Hormuz, raising hopes that safe transit through the waterway will be normalised.
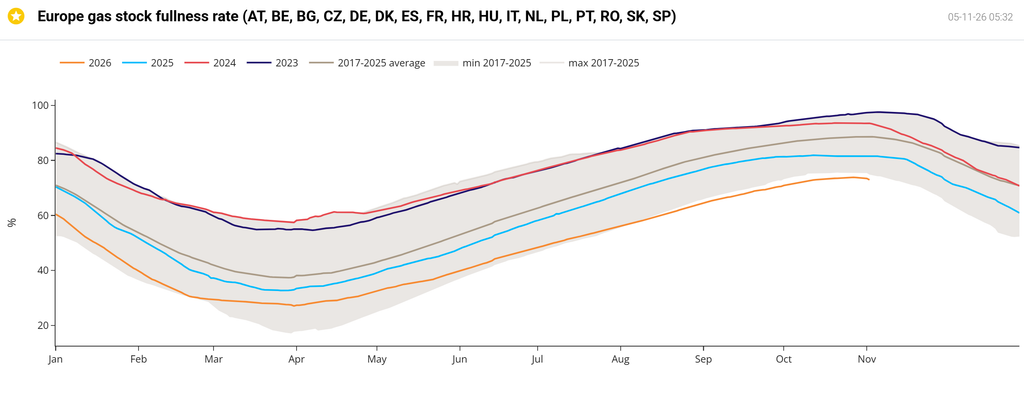
With the heating season now well and truly underway, net storage withdrawal persists with fullness having fallen to 73% versus the 8-year average of 88%:
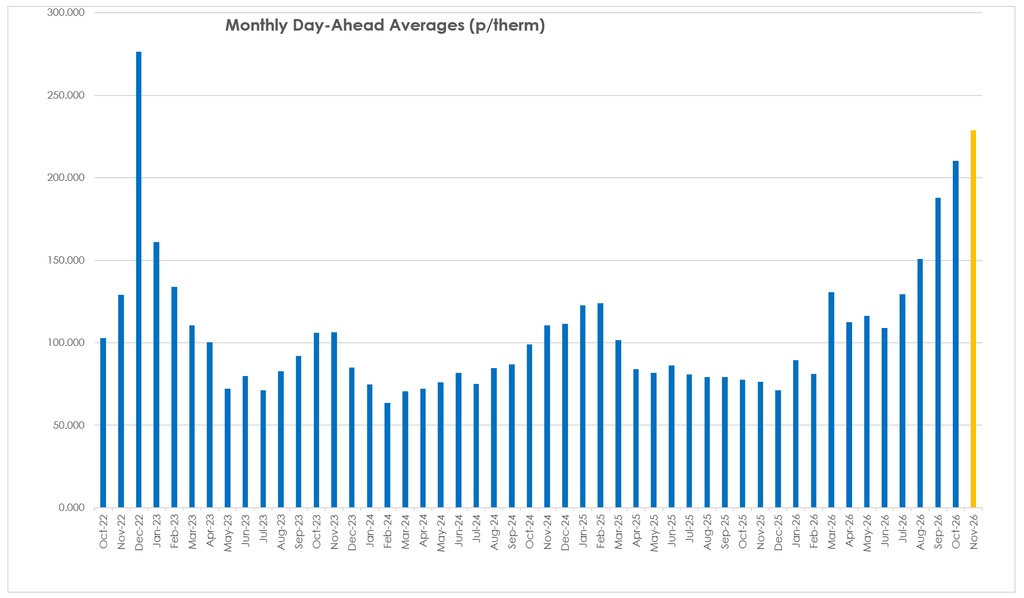
November’s Monthly Day-Ahead Average has declined to 229p/therm (or 7.8p/kwh exc non-gas):
ELECTRICITY & CARBON
Electricity prices are mirroring gas moves, with Seasonal Forwards down all the way out versus 1-week ago:
View as table
| Season | Last close (£/MWh) | 1 week ago | 1 month ago | 3 months ago | 6 months ago |
|---|---|---|---|---|---|
| SUM 27 | 124.31 | 133.69 | 108.14 | 78.51 | 76.15 |
| WIN 27 | 122.91 | 133.96 | 110.46 | 81.00 | 79.36 |
| SUM 28 | 77.84 | 86.73 | 74.77 | 62.34 | 60.25 |
| WIN 28 | 84.70 | 91.90 | 82.65 | 70.06 | 69.77 |
| SUM 29 | 70.10 | 75.58 | 69.71 | 61.54 | 60.93 |
| WIN 29 | 75.85 | 81.61 | 77.61 | 70.10 | 68.92 |
| SUM 30 | 70.42 | 73.81 | 68.44 | 63.08 | 62.61 |
Electricity remains a relative discount to gas, and it would seem likley that electricity prices will fall further, faster, in the event that a US/Iran peace deal can be agreed over the coming weeks:
View as table
| Week ending | Gas index | Gas (p/therm) | Power index | Power (£/MWh) |
|---|---|---|---|---|
| 8 Nov 2024 | 100.0 | 106.63 | 100.0 | 89.77 |
| 15 Nov 2024 | 109.2 | 116.40 | 106.8 | 95.85 |
| 22 Nov 2024 | 109.4 | 116.69 | 106.2 | 95.33 |
| 29 Nov 2024 | 109.8 | 117.09 | 107.6 | 96.60 |
| 6 Dec 2024 | 108.2 | 115.35 | 109.7 | 98.48 |
| 13 Dec 2024 | 96.4 | 102.79 | 99.6 | 89.38 |
| 20 Dec 2024 | 102.1 | 108.84 | 104.2 | 93.51 |
| 27 Dec 2024 | 111.7 | 119.06 | 114.9 | 103.18 |
| 3 Jan 2025 | 116.3 | 123.97 | 114.4 | 102.67 |
| 10 Jan 2025 | 107.0 | 114.07 | 103.7 | 93.10 |
| 17 Jan 2025 | 111.6 | 119.04 | 107.3 | 96.35 |
| 24 Jan 2025 | 116.8 | 124.51 | 118.3 | 106.18 |
| 31 Jan 2025 | 124.9 | 133.23 | 128.4 | 115.25 |
| 7 Feb 2025 | 127.0 | 135.48 | 124.2 | 111.47 |
| 14 Feb 2025 | 114.9 | 122.47 | 112.6 | 101.07 |
| 21 Feb 2025 | 103.6 | 110.51 | 102.5 | 91.99 |
| 28 Feb 2025 | 99.4 | 105.98 | 100.2 | 89.94 |
| 7 Mar 2025 | 90.6 | 96.66 | 90.9 | 81.59 |
| 14 Mar 2025 | 97.4 | 103.85 | 97.0 | 87.05 |
| 21 Mar 2025 | 96.7 | 103.13 | 99.2 | 89.10 |
| 28 Mar 2025 | 92.0 | 98.08 | 95.4 | 85.62 |
| 4 Apr 2025 | 83.0 | 88.49 | 81.4 | 73.05 |
| 11 Apr 2025 | 77.6 | 82.76 | 79.7 | 71.55 |
| 17 Apr 2025 | 81.6 | 87.01 | 83.9 | 75.32 |
| 25 Apr 2025 | 72.9 | 77.77 | 80.7 | 72.43 |
| 2 May 2025 | 74.7 | 79.63 | 82.2 | 73.80 |
| 9 May 2025 | 77.3 | 82.48 | 84.1 | 75.50 |
| 16 May 2025 | 78.2 | 83.42 | 84.0 | 75.42 |
| 23 May 2025 | 81.9 | 87.33 | 86.6 | 77.78 |
| 30 May 2025 | 75.4 | 80.38 | 79.3 | 71.22 |
| 6 Jun 2025 | 79.6 | 84.90 | 85.3 | 76.55 |
| 13 Jun 2025 | 83.7 | 89.27 | 90.9 | 81.65 |
| 20 Jun 2025 | 89.7 | 95.66 | 91.2 | 81.88 |
| 27 Jun 2025 | 71.3 | 76.05 | 79.5 | 71.40 |
| 4 Jul 2025 | 74.2 | 79.12 | 80.6 | 72.38 |
| 11 Jul 2025 | 80.1 | 85.44 | 84.6 | 75.95 |
| 18 Jul 2025 | 74.9 | 79.92 | 80.6 | 72.40 |
| 25 Jul 2025 | 73.8 | 78.65 | 81.4 | 73.05 |
| 1 Aug 2025 | 78.1 | 83.33 | 86.0 | 77.20 |
| 8 Aug 2025 | 74.2 | 79.09 | 86.0 | 77.24 |
| 15 Aug 2025 | 71.5 | 76.23 | 81.9 | 73.52 |
| 22 Aug 2025 | 78.0 | 83.14 | 87.0 | 78.08 |
| 29 Aug 2025 | 73.1 | 77.95 | 82.6 | 74.18 |
| 5 Sep 2025 | 75.7 | 80.75 | 82.9 | 74.43 |
| 12 Sep 2025 | 77.5 | 82.60 | 83.3 | 74.75 |
| 19 Sep 2025 | 77.1 | 82.18 | 84.6 | 75.95 |
| 26 Sep 2025 | 78.1 | 83.32 | 82.9 | 74.38 |
| 3 Oct 2025 | 76.8 | 81.87 | 91.0 | 81.71 |
| 10 Oct 2025 | 77.9 | 83.03 | 92.4 | 82.92 |
| 17 Oct 2025 | 76.7 | 81.75 | 92.6 | 83.12 |
| 24 Oct 2025 | 76.7 | 81.82 | 88.2 | 79.21 |
| 31 Oct 2025 | 75.8 | 80.86 | 88.9 | 79.78 |
| 7 Nov 2025 | 76.8 | 81.90 | 90.0 | 80.79 |
| 14 Nov 2025 | 77.5 | 82.65 | 92.0 | 82.58 |
| 21 Nov 2025 | 74.2 | 79.10 | 91.0 | 81.68 |
| 28 Nov 2025 | 70.6 | 75.24 | 91.6 | 82.24 |
| 5 Dec 2025 | 66.2 | 70.55 | 87.8 | 78.83 |
| 12 Dec 2025 | 67.7 | 72.22 | 91.3 | 81.93 |
| 19 Dec 2025 | 69.3 | 73.91 | 95.3 | 85.58 |
| 26 Dec 2025 | 68.7 | 73.25 | 95.0 | 85.32 |
| 2 Jan 2026 | 68.6 | 73.11 | 93.3 | 83.75 |
| 9 Jan 2026 | 66.4 | 70.84 | 92.3 | 82.83 |
| 16 Jan 2026 | 86.1 | 91.80 | 117.0 | 105.02 |
| 23 Jan 2026 | 92.1 | 98.26 | 118.7 | 106.56 |
| 30 Jan 2026 | 89.3 | 95.20 | 111.6 | 100.17 |
| 6 Feb 2026 | 77.1 | 82.18 | 92.5 | 83.00 |
| 13 Feb 2026 | 70.4 | 75.10 | 82.5 | 74.08 |
| 20 Feb 2026 | 72.0 | 76.82 | 82.3 | 73.90 |
| 27 Feb 2026 | 73.4 | 78.23 | 81.7 | 73.31 |
| 6 Mar 2026 | 125.8 | 134.17 | 113.2 | 101.63 |
| 13 Mar 2026 | 119.3 | 127.19 | 107.8 | 96.79 |
| 20 Mar 2026 | 140.6 | 149.97 | 118.5 | 106.42 |
| 27 Mar 2026 | 127.9 | 136.39 | 110.5 | 99.20 |
| 2 Apr 2026 | 118.1 | 125.95 | 106.8 | 95.90 |
| 10 Apr 2026 | 102.4 | 109.21 | 96.9 | 87.01 |
| 17 Apr 2026 | 90.1 | 96.12 | 91.8 | 82.39 |
| 24 Apr 2026 | 104.3 | 111.23 | 100.3 | 90.01 |
| 1 May 2026 | 104.1 | 111.06 | 103.6 | 92.98 |
| 8 May 2026 | 100.5 | 107.17 | 102.8 | 92.30 |
| 15 May 2026 | 115.2 | 122.82 | 114.3 | 102.62 |
| 22 May 2026 | 109.9 | 117.24 | 112.0 | 100.58 |
| 29 May 2026 | 103.4 | 110.23 | 111.0 | 99.66 |
| 5 Jun 2026 | 109.9 | 117.21 | 114.6 | 102.89 |
| 12 Jun 2026 | 105.0 | 111.95 | 109.9 | 98.70 |
| 19 Jun 2026 | 94.9 | 101.24 | 105.5 | 94.71 |
| 26 Jun 2026 | 91.6 | 97.67 | 101.2 | 90.89 |
| 3 Jul 2026 | 101.4 | 108.14 | 107.8 | 96.76 |
| 10 Jul 2026 | 109.5 | 116.74 | 113.8 | 102.20 |
| 17 Jul 2026 | 130.7 | 139.42 | 128.5 | 115.38 |
| 24 Jul 2026 | 142.6 | 152.04 | 141.7 | 127.18 |
| 31 Jul 2026 | 132.7 | 141.54 | 134.5 | 120.78 |
| 7 Aug 2026 | 127.6 | 136.12 | 128.9 | 115.74 |
| 14 Aug 2026 | 140.1 | 149.40 | 137.7 | 123.62 |
| 21 Aug 2026 | 153.3 | 163.46 | 143.3 | 128.68 |
| 28 Aug 2026 | 152.3 | 162.38 | 145.2 | 130.34 |
| 4 Sep 2026 | 167.8 | 178.90 | 155.8 | 139.89 |
| 11 Sep 2026 | 186.8 | 199.17 | 170.7 | 153.22 |
| 18 Sep 2026 | 184.6 | 196.86 | 170.8 | 153.34 |
| 25 Sep 2026 | 167.4 | 178.49 | 158.2 | 142.05 |
| 2 Oct 2026 | 177.3 | 189.01 | 171.0 | 153.49 |
| 9 Oct 2026 | 190.4 | 202.98 | 181.0 | 162.52 |
| 16 Oct 2026 | 203.5 | 216.98 | 188.8 | 169.45 |
| 23 Oct 2026 | 214.1 | 228.31 | 200.9 | 180.37 |
| 30 Oct 2026 | 240.1 | 256.06 | 223.6 | 200.76 |
| 5 Nov 2026 | 210.1 | 224.00 | 201.8 | 181.17 |
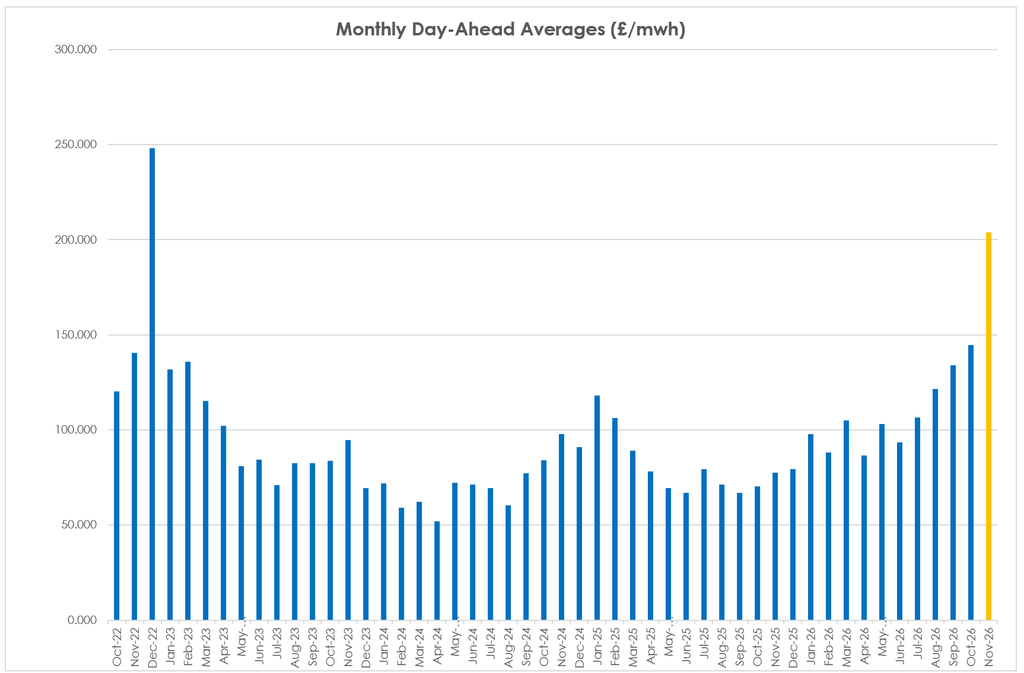
November’s Monthly Day-Ahead Average so far is on the slide, now at 204p/therm (or 20.4p/kwh exc non-energy):
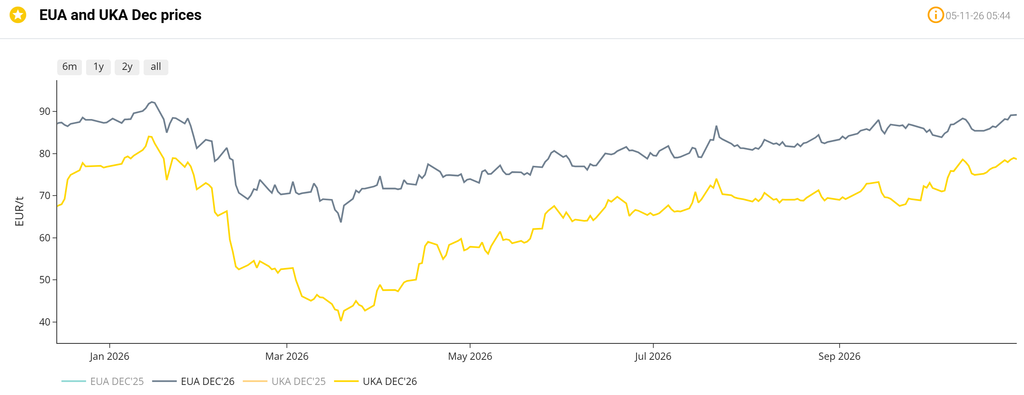
On the Carbon side of things, mid-price Dec-26 UKA delivery sits at at £66.58/tn (and the spot is at mid 65s) – with UK CBAM imminent for Jan ’27, EUA/UKA linkage looks nailed-on (which means, as the significantly less liquid market, UKAs are rising to parity):