


Trump’s last ditch attempt to save the mid-terms
GAS
Front-end delivery markets remain high and wide, with Trump’s foreign policy growing increasingly incoherent as the threat of a Republican drubbing at the November mid-terms looms large.
With a view to lowering global diesel prices, Trump has committed what might turn out to be his least popular flip-flop yet.
Despite having signed into law only three weeks ago tariffs up to 100% on high-profile buyers of Russian energy, Trump is blindsiding Ukraine’s President Volodymyr Zelenskyy on numerous fronts. First on 9th Oct, when he unilaterally decided to let Russian diesel imports into the US under a sanctions waiver running until Apr ’27. Then on Sunday, when he declared that Russia and Ukraine had agreed to cease attacking each other’s energy infrastructure, which neither were aware of! Then today it’s transpired that the order to restrict Starlink’s operations in Ukraine (needed so as to fend off Russia’s increasingly fatal attacks) came not from Elon Musk, but from the White House (source: Reuters).
And so, near-term delivery prices (including Summer-27) remain near their highest levels since late ’22, supported by head-spinning geopolitical risk and Europe’s historically low gas storage position (please chart below):
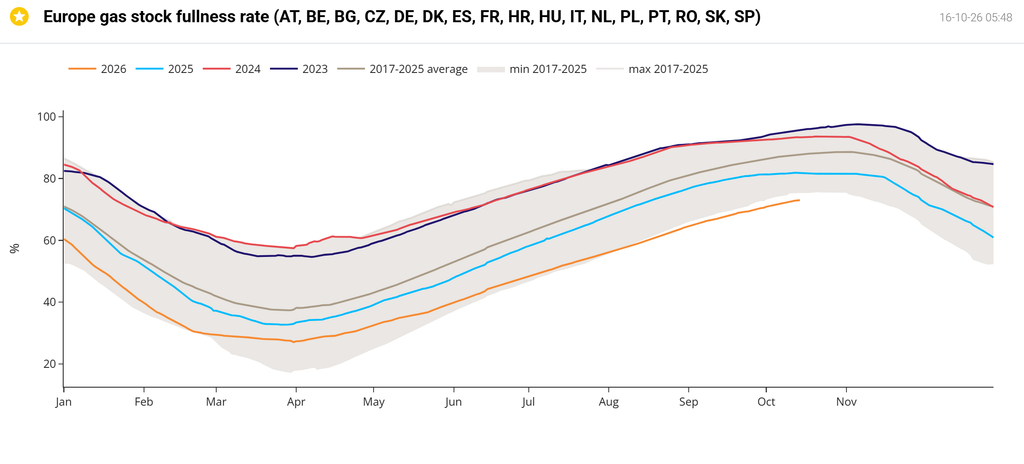
Thankfully, milder weather and softer Asian demand have been keeping a lid on speculative bullish fervour. Nonetheless, amid Trump’s unsettling policy outputs, markets are careering at pace toward November’s D-Day:
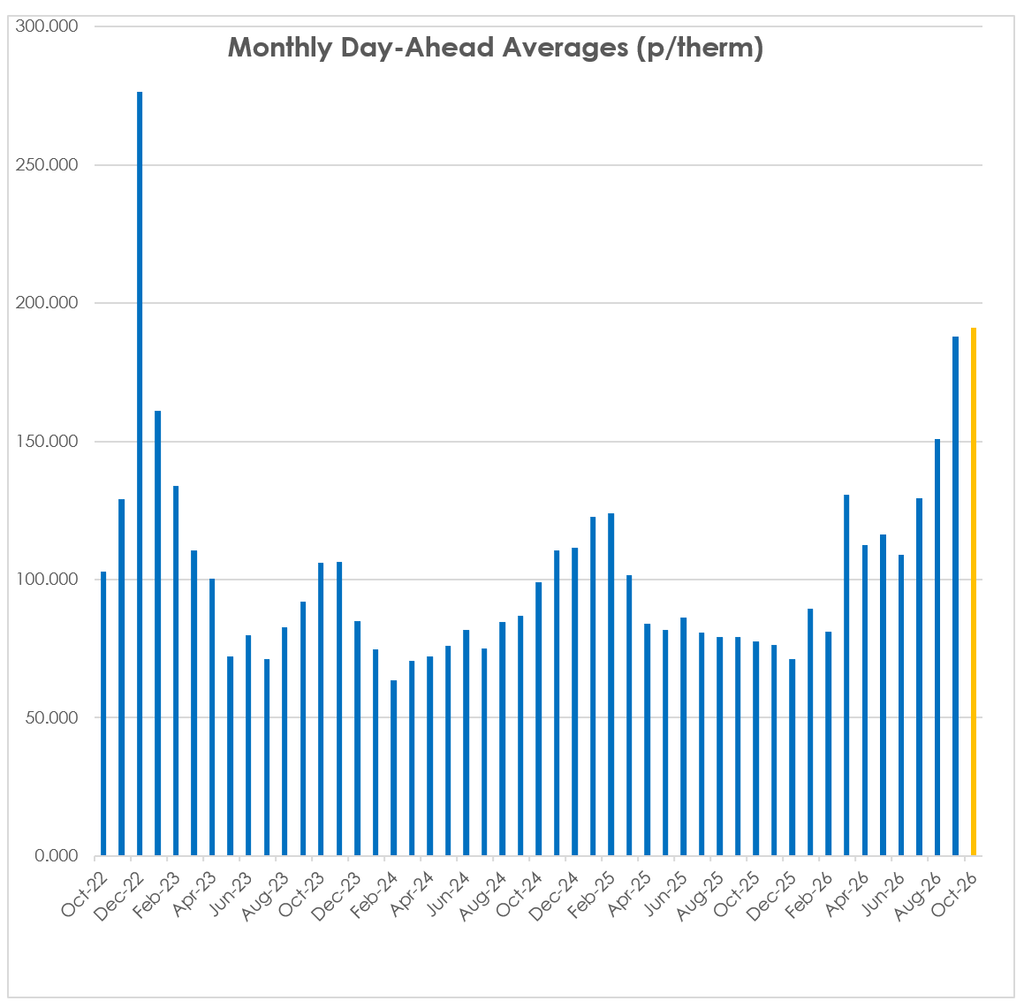
Monthly Day-Ahead Averages for October so far are at 191p/therm (or 6.5p/kwh exc non-gas) – having surpassed last month’s final number:
Monthly Forwards at the front-end are at a 177% premium to offers at the back end of the curve (reflecting the degree of speculative froth we’re contending with right now):
View as table
| Contract | Latest close (p/therm) | One month ago |
|---|---|---|
| NOV 26 | 216.70 | 197.26 |
| DEC 26 | 220.01 | 198.79 |
| JAN 27 | 221.72 | 199.58 |
| FEB 27 | 220.48 | 197.70 |
| MAR 27 | 210.32 | 188.74 |
| APR 27 | 182.56 | 153.48 |
| MAY 27 | 169.38 | 135.96 |
| JUN 27 | 161.91 | 128.48 |
| JUL 27 | 158.07 | 126.98 |
| AUG 27 | 158.05 | 126.34 |
| SEP 27 | 157.48 | 124.61 |
| OCT 27 | 155.57 | 124.77 |
| NOV 27 | 157.92 | 128.48 |
| DEC 27 | 160.38 | 130.61 |
| JAN 28 | 160.38 | 130.34 |
| FEB 28 | 156.74 | 128.14 |
| MAR 28 | 145.88 | 117.70 |
| APR 28 | 108.91 | 89.69 |
| MAY 28 | 99.60 | 81.74 |
| JUN 28 | 96.88 | 79.05 |
| JUL 28 | 92.88 | 77.60 |
| AUG 28 | 92.85 | 77.55 |
| SEP 28 | 93.97 | 78.73 |
| OCT 28 | 98.15 | 84.08 |
| NOV 28 | 101.08 | 86.99 |
| DEC 28 | 103.34 | 89.26 |
| JAN 29 | 105.18 | 90.91 |
| FEB 29 | 103.73 | 89.62 |
| MAR 29 | 100.30 | 86.56 |
| APR 29 | 81.20 | 72.85 |
| MAY 29 | 76.87 | 68.93 |
| JUN 29 | 75.23 | 67.14 |
| JUL 29 | 74.39 | 66.47 |
| AUG 29 | 75.07 | 67.10 |
| SEP 29 | 76.20 | 68.43 |
| OCT 29 | 80.58 | 73.00 |
| NOV 29 | 83.32 | 75.57 |
| DEC 29 | 85.43 | 77.68 |
| JAN 30 | 86.85 | 79.11 |
| FEB 30 | 87.26 | 79.42 |
| MAR 30 | 85.26 | 77.63 |
| APR 30 | 74.97 | 70.75 |
| MAY 30 | 72.32 | 68.38 |
| JUN 30 | 69.94 | 65.99 |
| JUL 30 | 68.05 | 64.23 |
| AUG 30 | 67.64 | 63.83 |
| SEP 30 | 69.23 | 65.25 |
| OCT 30 | 76.20 | 71.66 |
| NOV 30 | 79.24 | 74.44 |
| DEC 30 | 81.19 | 76.42 |
ELECTRICITY & CARBON
Electricity Seasonal Forwards remain at a comparative discount to gas (see relative strength chart below), reflecting the increasingly unrealistic premiums being assigned to fossil fuel transit/supply risk as the winter deepens:
View as table
| Week ending | Gas index | Gas (p/therm) | Power index | Power (£/MWh) |
|---|---|---|---|---|
| 18 Oct 2024 | 100.0 | 97.60 | 100.0 | 85.32 |
| 25 Oct 2024 | 112.8 | 110.07 | 112.5 | 96.00 |
| 1 Nov 2024 | 100.8 | 98.37 | 104.5 | 89.20 |
| 8 Nov 2024 | 109.3 | 106.63 | 105.2 | 89.77 |
| 15 Nov 2024 | 119.3 | 116.40 | 112.3 | 95.85 |
| 22 Nov 2024 | 119.6 | 116.69 | 111.7 | 95.33 |
| 29 Nov 2024 | 120.0 | 117.09 | 113.2 | 96.60 |
| 6 Dec 2024 | 118.2 | 115.35 | 115.4 | 98.48 |
| 13 Dec 2024 | 105.3 | 102.79 | 104.7 | 89.38 |
| 20 Dec 2024 | 111.5 | 108.84 | 109.6 | 93.51 |
| 27 Dec 2024 | 122.0 | 119.06 | 120.9 | 103.18 |
| 3 Jan 2025 | 127.0 | 123.97 | 120.3 | 102.67 |
| 10 Jan 2025 | 116.9 | 114.07 | 109.1 | 93.10 |
| 17 Jan 2025 | 122.0 | 119.04 | 112.9 | 96.35 |
| 24 Jan 2025 | 127.6 | 124.51 | 124.4 | 106.18 |
| 31 Jan 2025 | 136.5 | 133.23 | 135.1 | 115.25 |
| 7 Feb 2025 | 138.8 | 135.48 | 130.6 | 111.47 |
| 14 Feb 2025 | 125.5 | 122.47 | 118.5 | 101.07 |
| 21 Feb 2025 | 113.2 | 110.51 | 107.8 | 91.99 |
| 28 Feb 2025 | 108.6 | 105.98 | 105.4 | 89.94 |
| 7 Mar 2025 | 99.0 | 96.66 | 95.6 | 81.59 |
| 14 Mar 2025 | 106.4 | 103.85 | 102.0 | 87.05 |
| 21 Mar 2025 | 105.7 | 103.13 | 104.4 | 89.10 |
| 28 Mar 2025 | 100.5 | 98.08 | 100.4 | 85.62 |
| 4 Apr 2025 | 90.7 | 88.49 | 85.6 | 73.05 |
| 11 Apr 2025 | 84.8 | 82.76 | 83.9 | 71.55 |
| 17 Apr 2025 | 89.1 | 87.01 | 88.3 | 75.32 |
| 25 Apr 2025 | 79.7 | 77.77 | 84.9 | 72.43 |
| 2 May 2025 | 81.6 | 79.63 | 86.5 | 73.80 |
| 9 May 2025 | 84.5 | 82.48 | 88.5 | 75.50 |
| 16 May 2025 | 85.5 | 83.42 | 88.4 | 75.42 |
| 23 May 2025 | 89.5 | 87.33 | 91.2 | 77.78 |
| 30 May 2025 | 82.4 | 80.38 | 83.5 | 71.22 |
| 6 Jun 2025 | 87.0 | 84.90 | 89.7 | 76.55 |
| 13 Jun 2025 | 91.5 | 89.27 | 95.7 | 81.65 |
| 20 Jun 2025 | 98.0 | 95.66 | 96.0 | 81.88 |
| 27 Jun 2025 | 77.9 | 76.05 | 83.7 | 71.40 |
| 4 Jul 2025 | 81.1 | 79.12 | 84.8 | 72.38 |
| 11 Jul 2025 | 87.5 | 85.44 | 89.0 | 75.95 |
| 18 Jul 2025 | 81.9 | 79.92 | 84.9 | 72.40 |
| 25 Jul 2025 | 80.6 | 78.65 | 85.6 | 73.05 |
| 1 Aug 2025 | 85.4 | 83.33 | 90.5 | 77.20 |
| 8 Aug 2025 | 81.0 | 79.09 | 90.5 | 77.24 |
| 15 Aug 2025 | 78.1 | 76.23 | 86.2 | 73.52 |
| 22 Aug 2025 | 85.2 | 83.14 | 91.5 | 78.08 |
| 29 Aug 2025 | 79.9 | 77.95 | 86.9 | 74.18 |
| 5 Sep 2025 | 82.7 | 80.75 | 87.2 | 74.43 |
| 12 Sep 2025 | 84.6 | 82.60 | 87.6 | 74.75 |
| 19 Sep 2025 | 84.2 | 82.18 | 89.0 | 75.95 |
| 26 Sep 2025 | 85.4 | 83.32 | 87.2 | 74.38 |
| 3 Oct 2025 | 83.9 | 81.87 | 95.8 | 81.71 |
| 10 Oct 2025 | 85.1 | 83.03 | 97.2 | 82.92 |
| 17 Oct 2025 | 83.8 | 81.75 | 97.4 | 83.12 |
| 24 Oct 2025 | 83.8 | 81.82 | 92.8 | 79.21 |
| 31 Oct 2025 | 82.8 | 80.86 | 93.5 | 79.78 |
| 7 Nov 2025 | 83.9 | 81.90 | 94.7 | 80.79 |
| 14 Nov 2025 | 84.7 | 82.65 | 96.8 | 82.58 |
| 21 Nov 2025 | 81.0 | 79.10 | 95.7 | 81.68 |
| 28 Nov 2025 | 77.1 | 75.24 | 96.4 | 82.24 |
| 5 Dec 2025 | 72.3 | 70.55 | 92.4 | 78.83 |
| 12 Dec 2025 | 74.0 | 72.22 | 96.0 | 81.93 |
| 19 Dec 2025 | 75.7 | 73.91 | 100.3 | 85.58 |
| 26 Dec 2025 | 75.0 | 73.25 | 100.0 | 85.32 |
| 2 Jan 2026 | 74.9 | 73.11 | 98.2 | 83.75 |
| 9 Jan 2026 | 72.6 | 70.84 | 97.1 | 82.83 |
| 16 Jan 2026 | 94.1 | 91.80 | 123.1 | 105.02 |
| 23 Jan 2026 | 100.7 | 98.26 | 124.9 | 106.56 |
| 30 Jan 2026 | 97.5 | 95.20 | 117.4 | 100.17 |
| 6 Feb 2026 | 84.2 | 82.18 | 97.3 | 83.00 |
| 13 Feb 2026 | 76.9 | 75.10 | 86.8 | 74.08 |
| 20 Feb 2026 | 78.7 | 76.82 | 86.6 | 73.90 |
| 27 Feb 2026 | 80.2 | 78.23 | 85.9 | 73.31 |
| 6 Mar 2026 | 137.5 | 134.17 | 119.1 | 101.63 |
| 13 Mar 2026 | 130.3 | 127.19 | 113.4 | 96.79 |
| 20 Mar 2026 | 153.6 | 149.97 | 124.7 | 106.42 |
| 27 Mar 2026 | 139.7 | 136.39 | 116.3 | 99.20 |
| 2 Apr 2026 | 129.0 | 125.95 | 112.4 | 95.90 |
| 10 Apr 2026 | 111.9 | 109.21 | 102.0 | 87.01 |
| 17 Apr 2026 | 98.5 | 96.12 | 96.6 | 82.39 |
| 24 Apr 2026 | 114.0 | 111.23 | 105.5 | 90.01 |
| 1 May 2026 | 113.8 | 111.06 | 109.0 | 92.98 |
| 8 May 2026 | 109.8 | 107.17 | 108.2 | 92.30 |
| 15 May 2026 | 125.8 | 122.82 | 120.3 | 102.62 |
| 22 May 2026 | 120.1 | 117.24 | 117.9 | 100.58 |
| 29 May 2026 | 112.9 | 110.23 | 116.8 | 99.66 |
| 5 Jun 2026 | 120.1 | 117.21 | 120.6 | 102.89 |
| 12 Jun 2026 | 114.7 | 111.95 | 115.7 | 98.70 |
| 19 Jun 2026 | 103.7 | 101.24 | 111.0 | 94.71 |
| 26 Jun 2026 | 100.1 | 97.67 | 106.5 | 90.89 |
| 3 Jul 2026 | 110.8 | 108.14 | 113.4 | 96.76 |
| 10 Jul 2026 | 119.6 | 116.74 | 119.8 | 102.20 |
| 17 Jul 2026 | 142.8 | 139.42 | 135.2 | 115.38 |
| 24 Jul 2026 | 155.8 | 152.04 | 149.1 | 127.18 |
| 31 Jul 2026 | 145.0 | 141.54 | 141.6 | 120.78 |
| 7 Aug 2026 | 139.5 | 136.12 | 135.7 | 115.74 |
| 14 Aug 2026 | 153.1 | 149.40 | 144.9 | 123.62 |
| 21 Aug 2026 | 167.5 | 163.46 | 150.8 | 128.68 |
| 28 Aug 2026 | 166.4 | 162.38 | 152.8 | 130.34 |
| 4 Sep 2026 | 183.3 | 178.90 | 164.0 | 139.89 |
| 11 Sep 2026 | 204.1 | 199.17 | 179.6 | 153.22 |
| 18 Sep 2026 | 201.7 | 196.86 | 179.7 | 153.34 |
| 25 Sep 2026 | 182.9 | 178.49 | 166.5 | 142.05 |
| 2 Oct 2026 | 193.6 | 189.01 | 179.9 | 153.49 |
| 9 Oct 2026 | 208.0 | 202.98 | 190.5 | 162.52 |
| 16 Oct 2026 | 222.3 | 216.98 | 198.6 | 169.45 |
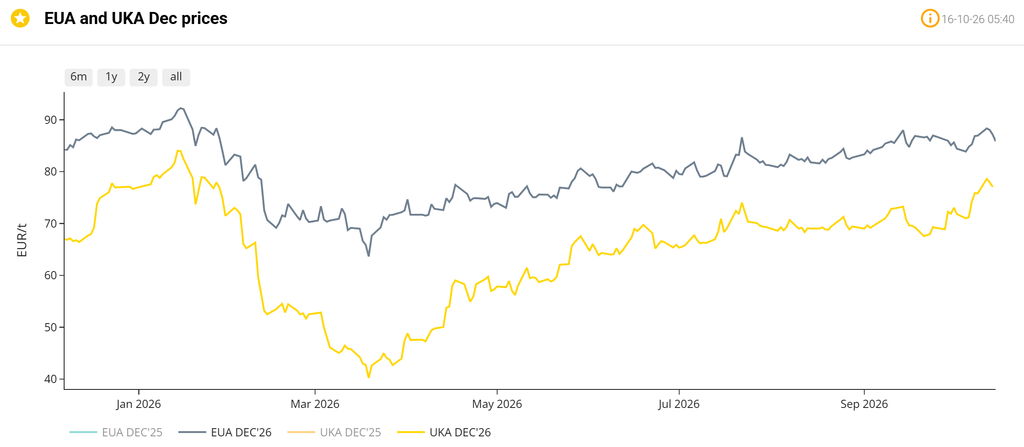
On the Carbon side of things, mid-price Dec-26 UKA delivery sits at at £63.82/tn (and the spot is at early 62s) – prices have shed some of last week’s gains depsite rumours that EUA/UKA linkage looks increasingly likely (which will inevitably mean UKA prices will need to rise to parity):
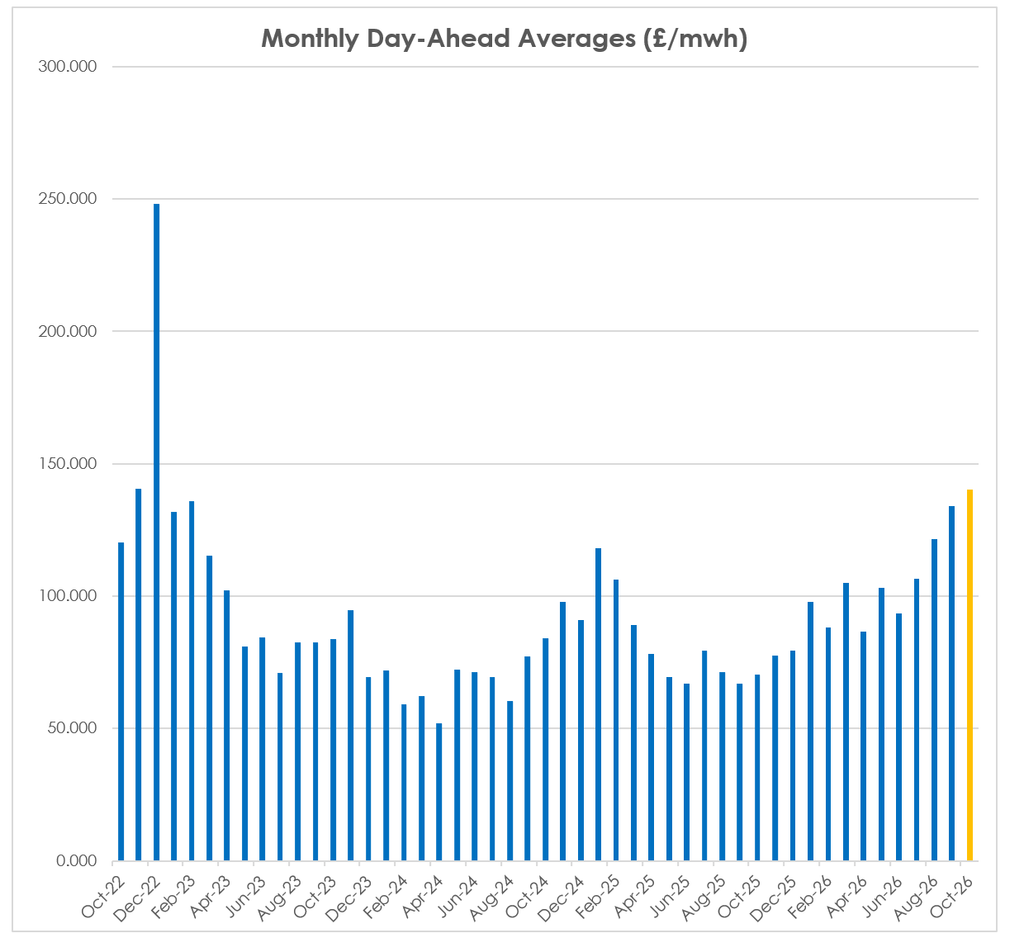
UK electricty Monthly Day-Ahead Averages for October so far are at £140mwh (or 14 p/kwh exc non-energy) – having surpassed last month’s final number: