


Parts of Europe show the first signs of net storage withdrawal (signalling the onset of the heating season)
GAS
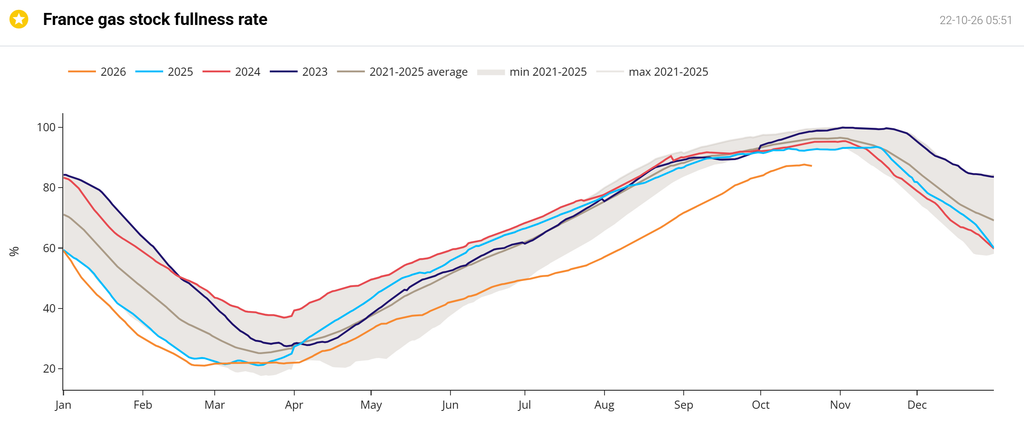
France and Germany recorded their first net storage withdrawals this week, on 19th and 20th October respectively – so, withdrawals exceeded injections, given increased demand versus stretched supply.
Whilst European storage as a whole is at 75% versus the 5-year average of 85%, France in particular is coming up well short of historical precedent (another problem facing Macron over the coming months):
As long as traffic in the Strait of Hormuz remains practically at a standstill, competition with Asia will inevitably limit European LNG imports.
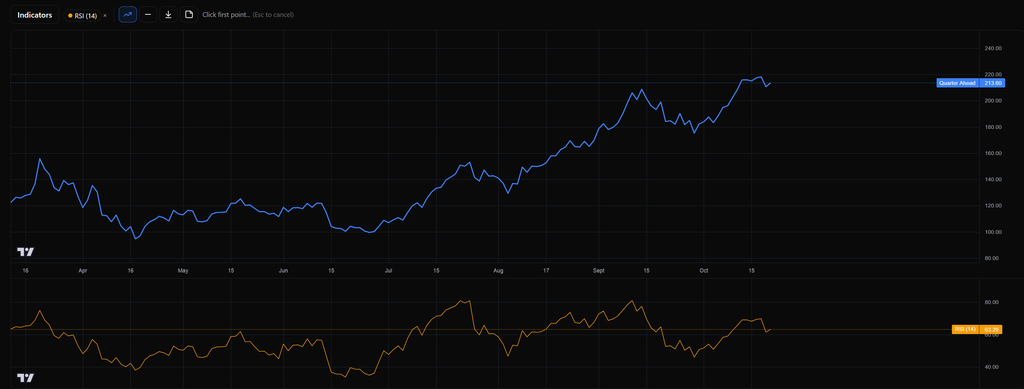
Under these conditions, it’s impossible for market participants to initiate a downward correction – despite overbought and divergent levels for front-end delivery. See Quarter-Ahead chart below showing RSI (Relative Strength Index) turning downwards versus price continuing to rise – this augurs a trend reversal, and reflects a slowing momentum to the bull rally:
The US State Department has ordered some diplomats and their families to leave Saudi Arabia amid escalating Houthi attacks. Three people were killed this week in strikes across the country, with two deaths caused by debris from a drone intercepted during an attempted attack on an oil field, and one in a strike at King Fahd International Airport in Dammam. With escalations ongoing, an inevitable risk premium persists across markets, and prices continue to over-react sharply to conflict headlines and fears of supply shortages.
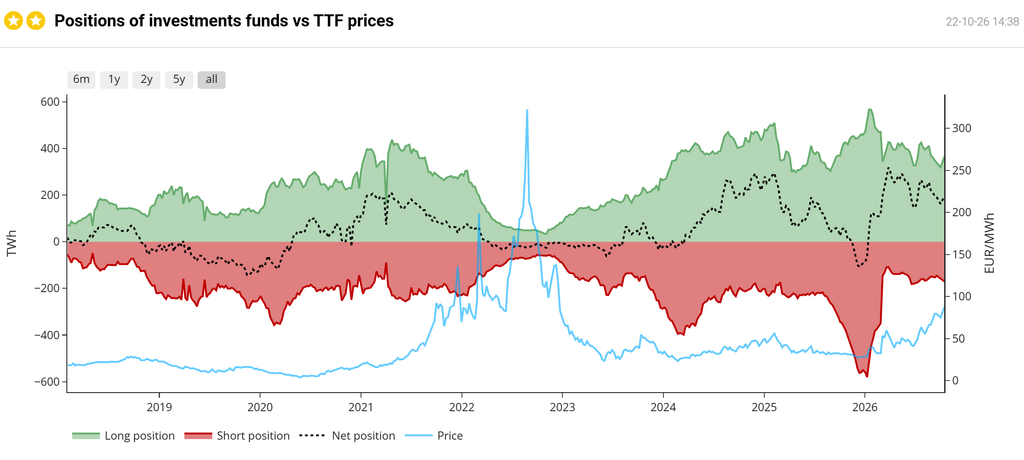
Speculative interest in TTF (the very liquid European gas benchmark) remains net long, with this week seeing renewed interest amid Trump’s Iranian impasse and worries over the Bab-el Mandeb Strait:
And so, little has changed this week versus last week – though forward prices have risen as we’re moving deeper into winter conditioning:
View as table
| Season | Last close (p/therm) | 1 week ago | 1 month ago | 3 months ago | 6 months ago |
|---|---|---|---|---|---|
| SUM 27 | 170.87 | 161.46 | 131.18 | 98.43 | 84.65 |
| WIN 27 | 162.64 | 154.02 | 127.70 | 95.33 | 85.56 |
| SUM 28 | 102.05 | 95.78 | 82.22 | 67.97 | 64.91 |
| WIN 28 | 105.96 | 100.24 | 88.97 | 75.00 | 71.15 |
| SUM 29 | 79.37 | 75.49 | 68.51 | 59.85 | 59.38 |
| WIN 29 | 87.41 | 84.11 | 77.78 | 69.31 | 67.75 |
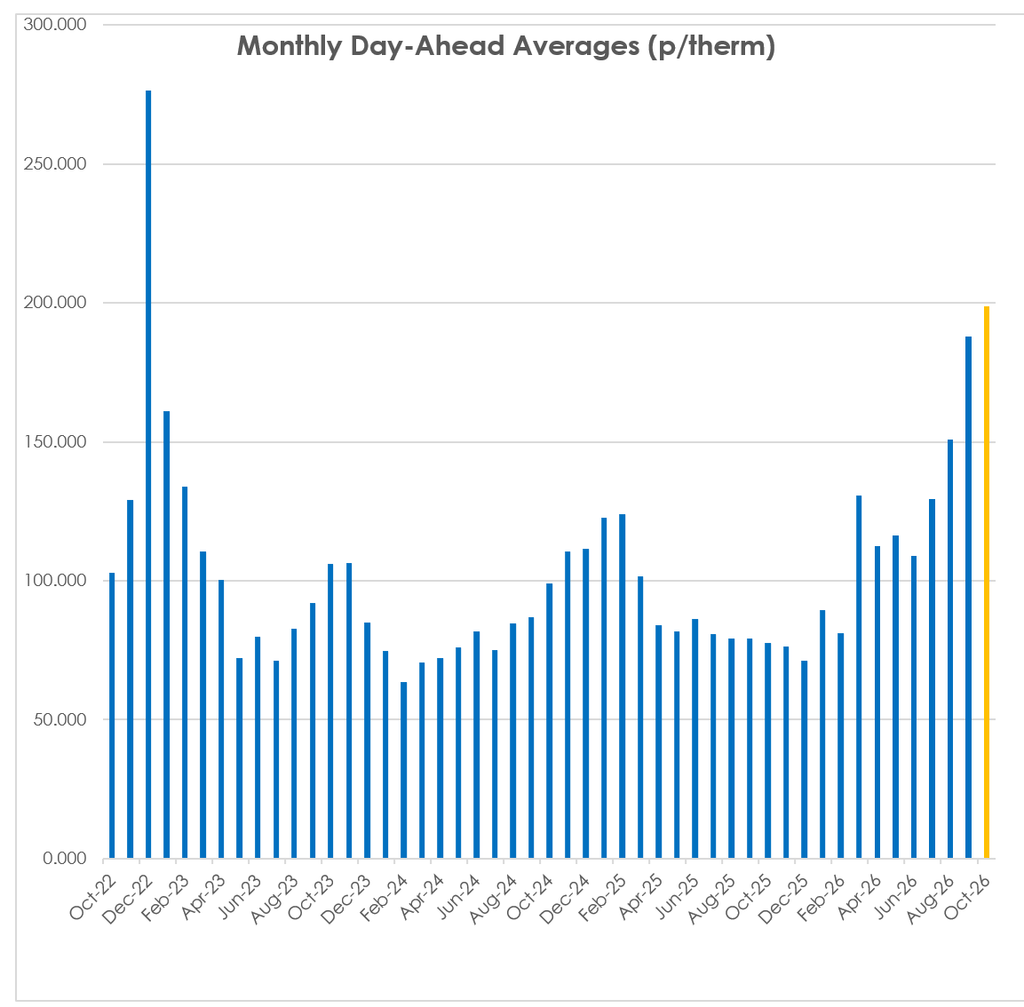
Monthly Day-Ahead Averages for October so far are at 198p/therm (or 6.7p/kwh exc non-gas) – having surpassed last month’s final number:
Monthly Forwards at the front-end are at a 179% premium to offers at the back end of the curve (reflecting the degree of speculative froth we’re contending with right now):
View as table
| Contract | Latest close (p/therm) | One month ago |
|---|---|---|
| NOV 26 | 221.75 | 186.12 |
| DEC 26 | 224.37 | 187.89 |
| JAN 27 | 225.75 | 188.76 |
| FEB 27 | 224.70 | 186.33 |
| MAR 27 | 213.30 | 176.19 |
| APR 27 | 187.45 | 147.59 |
| MAY 27 | 175.63 | 134.18 |
| JUN 27 | 168.18 | 128.36 |
| JUL 27 | 165.20 | 125.85 |
| AUG 27 | 164.59 | 126.46 |
| SEP 27 | 164.42 | 124.92 |
| OCT 27 | 162.19 | 125.60 |
| NOV 27 | 165.12 | 129.36 |
| DEC 27 | 167.40 | 131.74 |
| JAN 28 | 166.59 | 131.67 |
| FEB 28 | 162.77 | 129.26 |
| MAR 28 | 151.90 | 118.73 |
| APR 28 | 113.80 | 91.22 |
| MAY 28 | 104.10 | 83.27 |
| JUN 28 | 101.38 | 80.59 |
| JUL 28 | 97.50 | 79.12 |
| AUG 28 | 97.30 | 79.08 |
| SEP 28 | 98.46 | 80.26 |
| OCT 28 | 102.28 | 85.16 |
| NOV 28 | 105.23 | 88.07 |
| DEC 28 | 107.54 | 90.35 |
| JAN 29 | 109.06 | 92.17 |
| FEB 29 | 107.65 | 90.71 |
| MAR 29 | 104.18 | 87.51 |
| APR 29 | 84.20 | 73.02 |
| MAY 29 | 79.85 | 68.98 |
| JUN 29 | 77.88 | 67.17 |
| JUL 29 | 77.33 | 66.49 |
| AUG 29 | 77.93 | 67.10 |
| SEP 29 | 79.14 | 68.40 |
| OCT 29 | 83.17 | 73.71 |
| NOV 29 | 86.05 | 76.43 |
| DEC 29 | 88.28 | 78.55 |
| JAN 30 | 89.61 | 79.79 |
| FEB 30 | 89.95 | 80.10 |
| MAR 30 | 87.59 | 78.32 |
| APR 30 | 76.32 | 70.93 |
| MAY 30 | 73.68 | 68.47 |
| JUN 30 | 71.30 | 66.09 |
| JUL 30 | 69.42 | 64.32 |
| AUG 30 | 69.01 | 63.93 |
| SEP 30 | 70.68 | 65.35 |
| OCT 30 | 78.04 | 71.59 |
| NOV 30 | 81.17 | 74.36 |
| DEC 30 | 83.12 | 76.33 |
ELECTRICITY & CARBON
Electricity Seasonal Forwards remain at a comparative discount to gas (see value chart below), reflecting the increasingly unrealistic premiums being assigned to fossil fuel transit/supply risk as the winter deepens:
View as table
| Week ending | Gas index | Gas (p/therm) | Power index | Power (£/MWh) |
|---|---|---|---|---|
| 25 Oct 2024 | 100.0 | 110.07 | 100.0 | 96.00 |
| 1 Nov 2024 | 89.4 | 98.37 | 92.9 | 89.20 |
| 8 Nov 2024 | 96.9 | 106.63 | 93.5 | 89.77 |
| 15 Nov 2024 | 105.8 | 116.40 | 99.8 | 95.85 |
| 22 Nov 2024 | 106.0 | 116.69 | 99.3 | 95.33 |
| 29 Nov 2024 | 106.4 | 117.09 | 100.6 | 96.60 |
| 6 Dec 2024 | 104.8 | 115.35 | 102.6 | 98.48 |
| 13 Dec 2024 | 93.4 | 102.79 | 93.1 | 89.38 |
| 20 Dec 2024 | 98.9 | 108.84 | 97.4 | 93.51 |
| 27 Dec 2024 | 108.2 | 119.06 | 107.5 | 103.18 |
| 3 Jan 2025 | 112.6 | 123.97 | 107.0 | 102.67 |
| 10 Jan 2025 | 103.6 | 114.07 | 97.0 | 93.10 |
| 17 Jan 2025 | 108.2 | 119.04 | 100.4 | 96.35 |
| 24 Jan 2025 | 113.1 | 124.51 | 110.6 | 106.18 |
| 31 Jan 2025 | 121.0 | 133.23 | 120.0 | 115.25 |
| 7 Feb 2025 | 123.1 | 135.48 | 116.1 | 111.47 |
| 14 Feb 2025 | 111.3 | 122.47 | 105.3 | 101.07 |
| 21 Feb 2025 | 100.4 | 110.51 | 95.8 | 91.99 |
| 28 Feb 2025 | 96.3 | 105.98 | 93.7 | 89.94 |
| 7 Mar 2025 | 87.8 | 96.66 | 85.0 | 81.59 |
| 14 Mar 2025 | 94.3 | 103.85 | 90.7 | 87.05 |
| 21 Mar 2025 | 93.7 | 103.13 | 92.8 | 89.10 |
| 28 Mar 2025 | 89.1 | 98.08 | 89.2 | 85.62 |
| 4 Apr 2025 | 80.4 | 88.49 | 76.1 | 73.05 |
| 11 Apr 2025 | 75.2 | 82.76 | 74.5 | 71.55 |
| 17 Apr 2025 | 79.1 | 87.01 | 78.5 | 75.32 |
| 25 Apr 2025 | 70.7 | 77.77 | 75.4 | 72.43 |
| 2 May 2025 | 72.3 | 79.63 | 76.9 | 73.80 |
| 9 May 2025 | 74.9 | 82.48 | 78.6 | 75.50 |
| 16 May 2025 | 75.8 | 83.42 | 78.6 | 75.42 |
| 23 May 2025 | 79.3 | 87.33 | 81.0 | 77.78 |
| 30 May 2025 | 73.0 | 80.38 | 74.2 | 71.22 |
| 6 Jun 2025 | 77.1 | 84.90 | 79.7 | 76.55 |
| 13 Jun 2025 | 81.1 | 89.27 | 85.1 | 81.65 |
| 20 Jun 2025 | 86.9 | 95.66 | 85.3 | 81.88 |
| 27 Jun 2025 | 69.1 | 76.05 | 74.4 | 71.40 |
| 4 Jul 2025 | 71.9 | 79.12 | 75.4 | 72.38 |
| 11 Jul 2025 | 77.6 | 85.44 | 79.1 | 75.95 |
| 18 Jul 2025 | 72.6 | 79.92 | 75.4 | 72.40 |
| 25 Jul 2025 | 71.5 | 78.65 | 76.1 | 73.05 |
| 1 Aug 2025 | 75.7 | 83.33 | 80.4 | 77.20 |
| 8 Aug 2025 | 71.9 | 79.09 | 80.5 | 77.24 |
| 15 Aug 2025 | 69.3 | 76.23 | 76.6 | 73.52 |
| 22 Aug 2025 | 75.5 | 83.14 | 81.3 | 78.08 |
| 29 Aug 2025 | 70.8 | 77.95 | 77.3 | 74.18 |
| 5 Sep 2025 | 73.4 | 80.75 | 77.5 | 74.43 |
| 12 Sep 2025 | 75.0 | 82.60 | 77.9 | 74.75 |
| 19 Sep 2025 | 74.7 | 82.18 | 79.1 | 75.95 |
| 26 Sep 2025 | 75.7 | 83.32 | 77.5 | 74.38 |
| 3 Oct 2025 | 74.4 | 81.87 | 85.1 | 81.71 |
| 10 Oct 2025 | 75.4 | 83.03 | 86.4 | 82.92 |
| 17 Oct 2025 | 74.3 | 81.75 | 86.6 | 83.12 |
| 24 Oct 2025 | 74.3 | 81.82 | 82.5 | 79.21 |
| 31 Oct 2025 | 73.5 | 80.86 | 83.1 | 79.78 |
| 7 Nov 2025 | 74.4 | 81.90 | 84.2 | 80.79 |
| 14 Nov 2025 | 75.1 | 82.65 | 86.0 | 82.58 |
| 21 Nov 2025 | 71.9 | 79.10 | 85.1 | 81.68 |
| 28 Nov 2025 | 68.4 | 75.24 | 85.7 | 82.24 |
| 5 Dec 2025 | 64.1 | 70.55 | 82.1 | 78.83 |
| 12 Dec 2025 | 65.6 | 72.22 | 85.3 | 81.93 |
| 19 Dec 2025 | 67.2 | 73.91 | 89.2 | 85.58 |
| 26 Dec 2025 | 66.6 | 73.25 | 88.9 | 85.32 |
| 2 Jan 2026 | 66.4 | 73.11 | 87.2 | 83.75 |
| 9 Jan 2026 | 64.4 | 70.84 | 86.3 | 82.83 |
| 16 Jan 2026 | 83.4 | 91.80 | 109.4 | 105.02 |
| 23 Jan 2026 | 89.3 | 98.26 | 111.0 | 106.56 |
| 30 Jan 2026 | 86.5 | 95.20 | 104.3 | 100.17 |
| 6 Feb 2026 | 74.7 | 82.18 | 86.5 | 83.00 |
| 13 Feb 2026 | 68.2 | 75.10 | 77.2 | 74.08 |
| 20 Feb 2026 | 69.8 | 76.82 | 77.0 | 73.90 |
| 27 Feb 2026 | 71.1 | 78.23 | 76.4 | 73.31 |
| 6 Mar 2026 | 121.9 | 134.17 | 105.9 | 101.63 |
| 13 Mar 2026 | 115.6 | 127.19 | 100.8 | 96.79 |
| 20 Mar 2026 | 136.3 | 149.97 | 110.9 | 106.42 |
| 27 Mar 2026 | 123.9 | 136.39 | 103.3 | 99.20 |
| 2 Apr 2026 | 114.4 | 125.95 | 99.9 | 95.90 |
| 10 Apr 2026 | 99.2 | 109.21 | 90.6 | 87.01 |
| 17 Apr 2026 | 87.3 | 96.12 | 85.8 | 82.39 |
| 24 Apr 2026 | 101.1 | 111.23 | 93.8 | 90.01 |
| 1 May 2026 | 100.9 | 111.06 | 96.8 | 92.98 |
| 8 May 2026 | 97.4 | 107.17 | 96.1 | 92.30 |
| 15 May 2026 | 111.6 | 122.82 | 106.9 | 102.62 |
| 22 May 2026 | 106.5 | 117.24 | 104.8 | 100.58 |
| 29 May 2026 | 100.2 | 110.23 | 103.8 | 99.66 |
| 5 Jun 2026 | 106.5 | 117.21 | 107.2 | 102.89 |
| 12 Jun 2026 | 101.7 | 111.95 | 102.8 | 98.70 |
| 19 Jun 2026 | 92.0 | 101.24 | 98.7 | 94.71 |
| 26 Jun 2026 | 88.7 | 97.67 | 94.7 | 90.89 |
| 3 Jul 2026 | 98.3 | 108.14 | 100.8 | 96.76 |
| 10 Jul 2026 | 106.1 | 116.74 | 106.5 | 102.20 |
| 17 Jul 2026 | 126.7 | 139.42 | 120.2 | 115.38 |
| 24 Jul 2026 | 138.1 | 152.04 | 132.5 | 127.18 |
| 31 Jul 2026 | 128.6 | 141.54 | 125.8 | 120.78 |
| 7 Aug 2026 | 123.7 | 136.12 | 120.6 | 115.74 |
| 14 Aug 2026 | 135.7 | 149.40 | 128.8 | 123.62 |
| 21 Aug 2026 | 148.5 | 163.46 | 134.0 | 128.68 |
| 28 Aug 2026 | 147.5 | 162.38 | 135.8 | 130.34 |
| 4 Sep 2026 | 162.5 | 178.90 | 145.7 | 139.89 |
| 11 Sep 2026 | 181.0 | 199.17 | 159.6 | 153.22 |
| 18 Sep 2026 | 178.9 | 196.86 | 159.7 | 153.34 |
| 25 Sep 2026 | 162.2 | 178.49 | 148.0 | 142.05 |
| 2 Oct 2026 | 171.7 | 189.01 | 159.9 | 153.49 |
| 9 Oct 2026 | 184.4 | 202.98 | 169.3 | 162.52 |
| 16 Oct 2026 | 197.1 | 216.98 | 176.5 | 169.45 |
| 22 Oct 2026 | 201.2 | 221.44 | 181.5 | 174.20 |
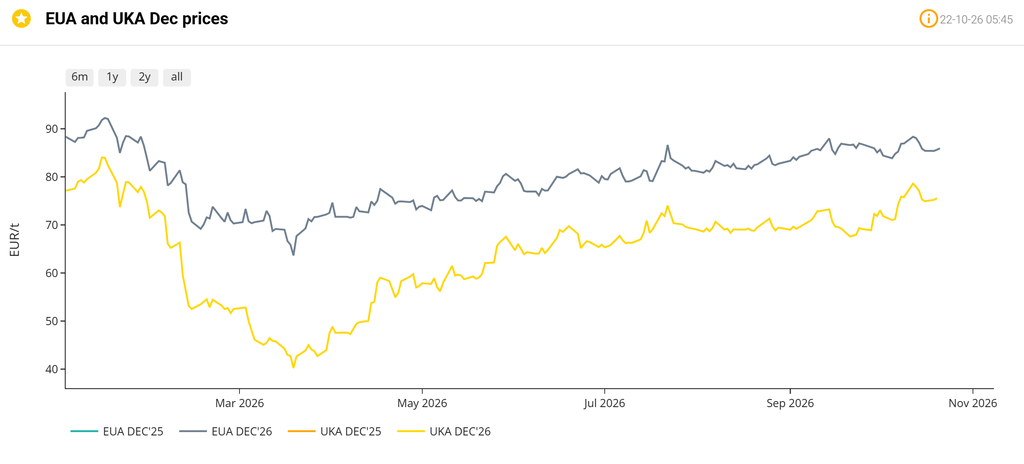
On the Carbon side of things, mid-price Dec-26 UKA delivery sits at at £64.13/tn (and the spot is at mid 63s) – with UK CBAM imminent for Jan ’27, EUA/UKA linkage looks increasingly likely (which will inevitably mean UKA prices will need to rise to parity):
Solid value persists further down the curve, with Summer-28 delivery onwards having been significantly less impacted by the current energy crisis over the past 6 months:
View as table
| Season | Six months ago (£/MWh) | Latest close | Change |
|---|---|---|---|
| SUM 27 | 73.03 | 129.83 | +77.8% |
| WIN 27 | 77.32 | 129.59 | +67.6% |
| SUM 28 | 59.81 | 83.10 | +38.9% |
| WIN 28 | 68.40 | 88.99 | +30.1% |
| SUM 29 | 60.84 | 73.55 | +20.9% |
| WIN 29 | 68.32 | 79.75 | +16.7% |
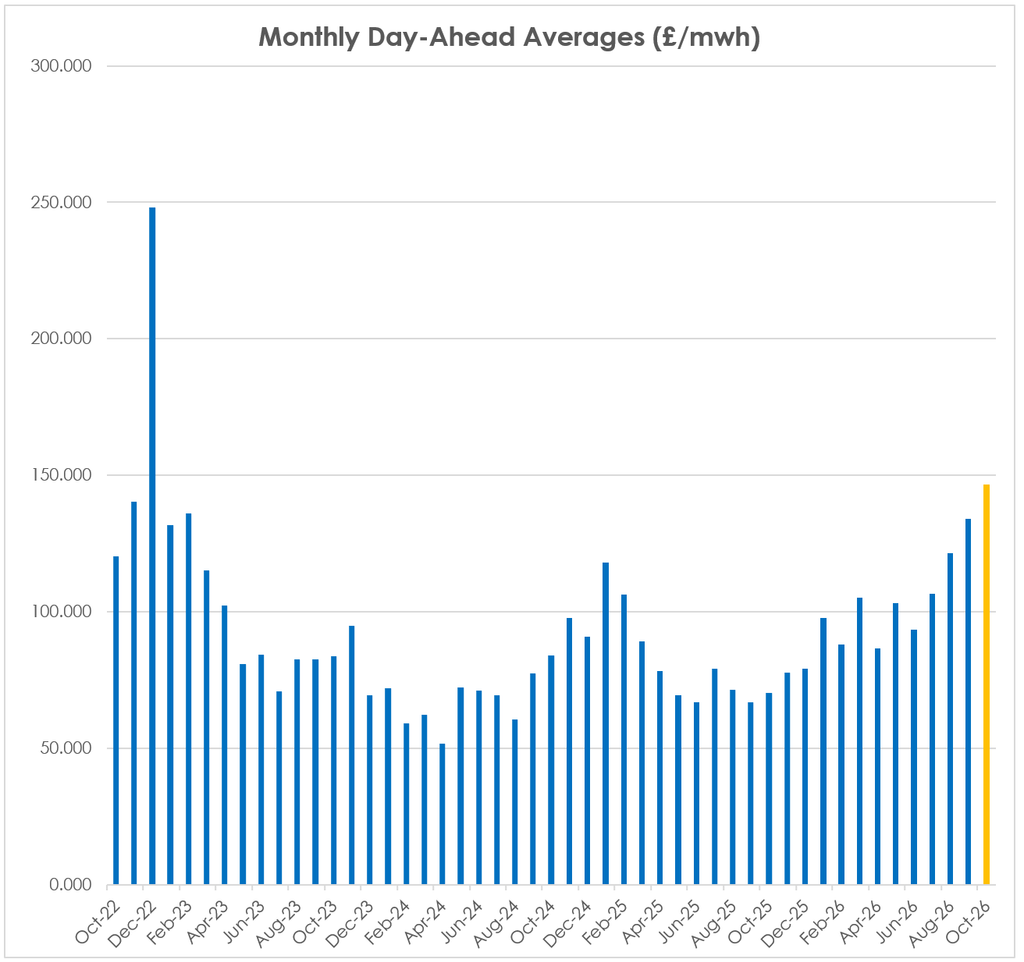
UK electricty Monthly Day-Ahead Averages for October so far are at £147mwh (or 14.7 p/kwh exc non-energy) – having surpassed last month’s final number: