



Gas markets surge with a week to go before the mid-terms
GAS
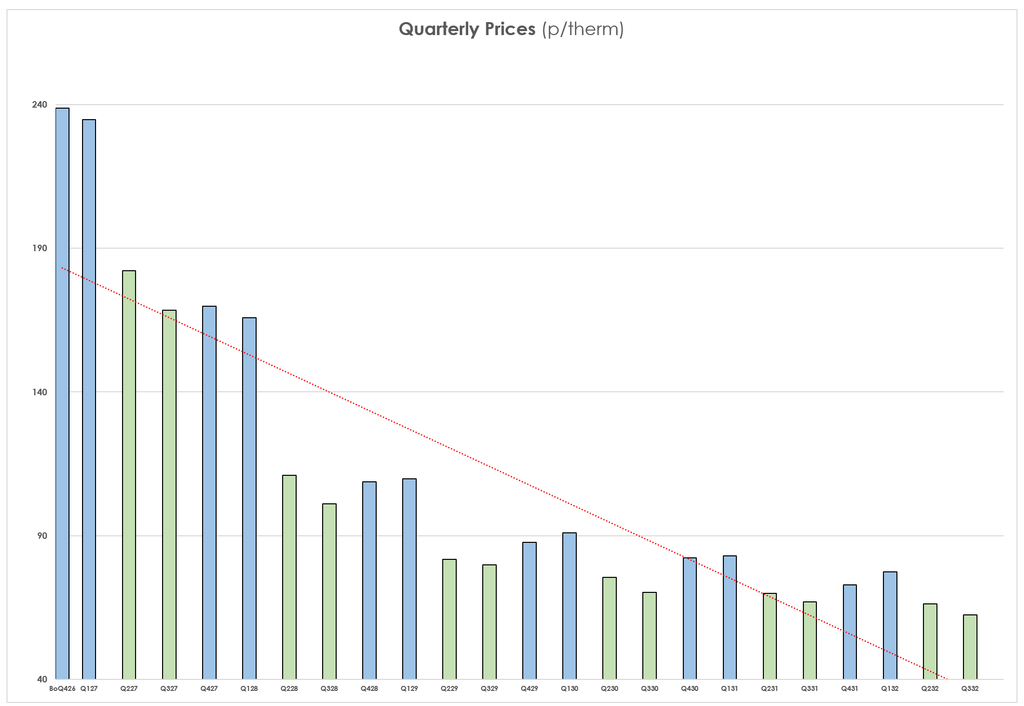
At yesterday’s close, the front-quarter (Q127) was at a 283% premium to offered prices at the back of the curve:
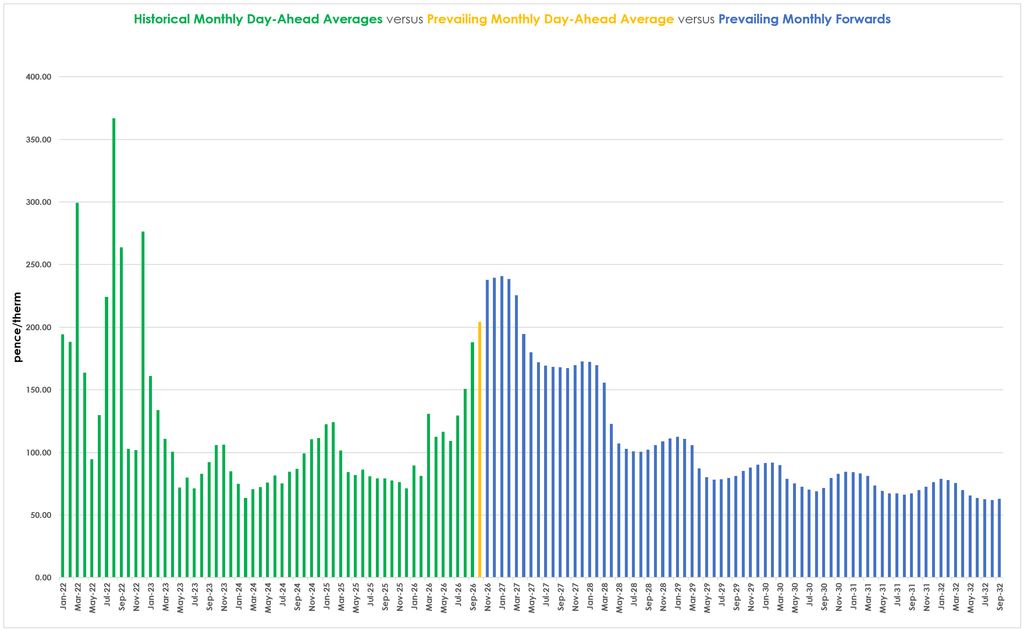
Notably, the GAS Monthly Day-Ahead Average for the month so far is at 204 p/therm (or 6.9p/kwh), which remains well-below the offered price of the remaining Winter-26 months – making buyers more likely to leave any open winter volumes to Day-Ahead until further notice:
With the Strait of Hormuz sill being held at gun point Qatar LNG remains under force majeure (denying international markets of roughly 80% of Gulf LNG flows).
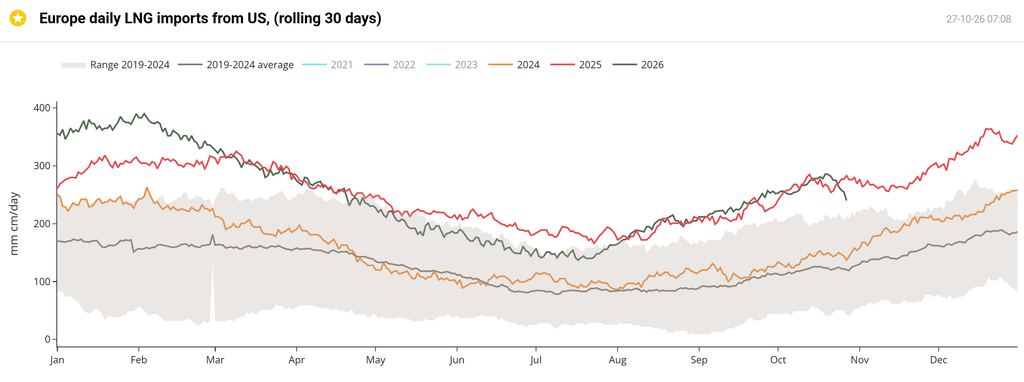
European storage fullness hovers precariously at 75% versus the 5-year average of 88%, and LNG imports to Europe have been on the slide beginning last week amid fierce competition for uncommitted Atlantic LNG cargoes as Asian buyers seek replacement volumes:
Not surprisingly, Seasonal Forwards are up on the week/month/3-months/6-months all the way down the curve:
View as table
| Season | Last close (p/therm) | 1 week ago | 1 month ago | 3 months ago | 6 months ago |
|---|---|---|---|---|---|
| SUM 27 | 174.74 | 162.17 | 131.22 | 96.27 | 86.64 |
| WIN 27 | 167.43 | 154.80 | 127.36 | 94.41 | 87.57 |
| SUM 28 | 105.99 | 97.27 | 84.21 | 68.50 | 66.12 |
| WIN 28 | 109.60 | 102.26 | 91.49 | 75.75 | 72.27 |
| SUM 29 | 80.90 | 76.96 | 70.29 | 60.88 | 59.58 |
| WIN 29 | 89.29 | 84.87 | 79.10 | 70.14 | 68.01 |
Despite a summer of assurances from the Trump Administration that salvation was at hand, in reality the front 2-Seasons have been a one-way bet since the failure of the MoU (Memorandum of Understanding) back in June:
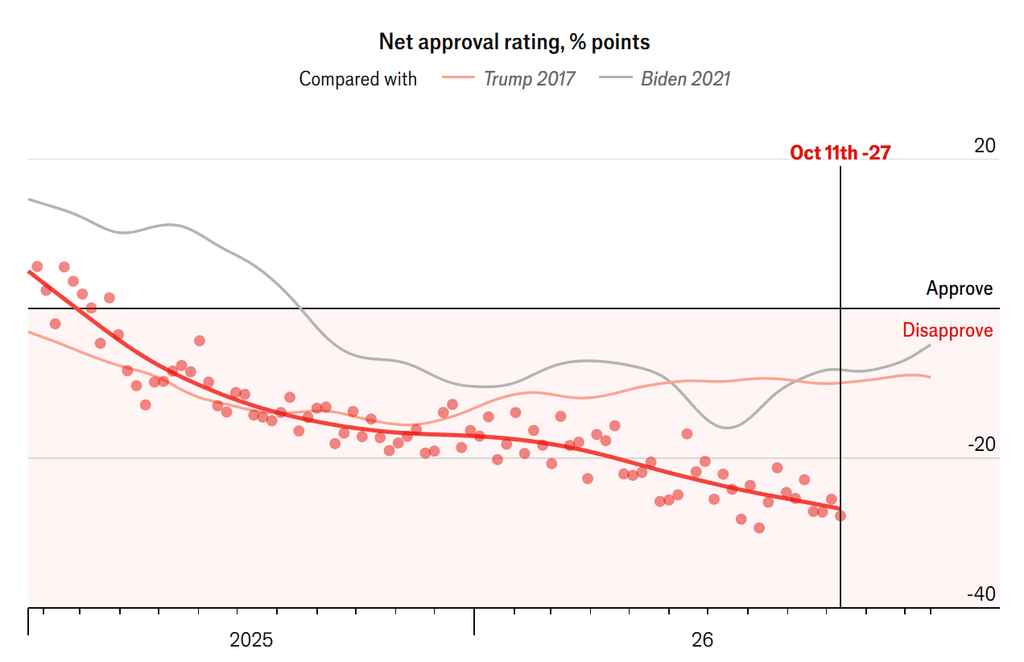
Trump’s net approval rating as of mid-October (as per YouGov poll, source: The Economist) is down to -27%, and so bulls continue to throw money at gas prices knowing that at least another week of uncertainty remains before the political direction of Congress becomes known:
Yesterday, benchmark contracts (TTF) enjoyed a temporary breather following news that Saudi Arabia, Turkey, and Pakistan had engaged with Iranian leaders in Tehran on Monday with a view to de-escalating regional hostilities, with Tehran describing the discussions as “very good”. Nonetheless, front month Brent crude trades at $115/bbl (approaching the highs posted in the weeks after Trump’s war on Iran began) as participants watch on anxiously to see whether US strikes will in fact resume following next week’s midterm elections:
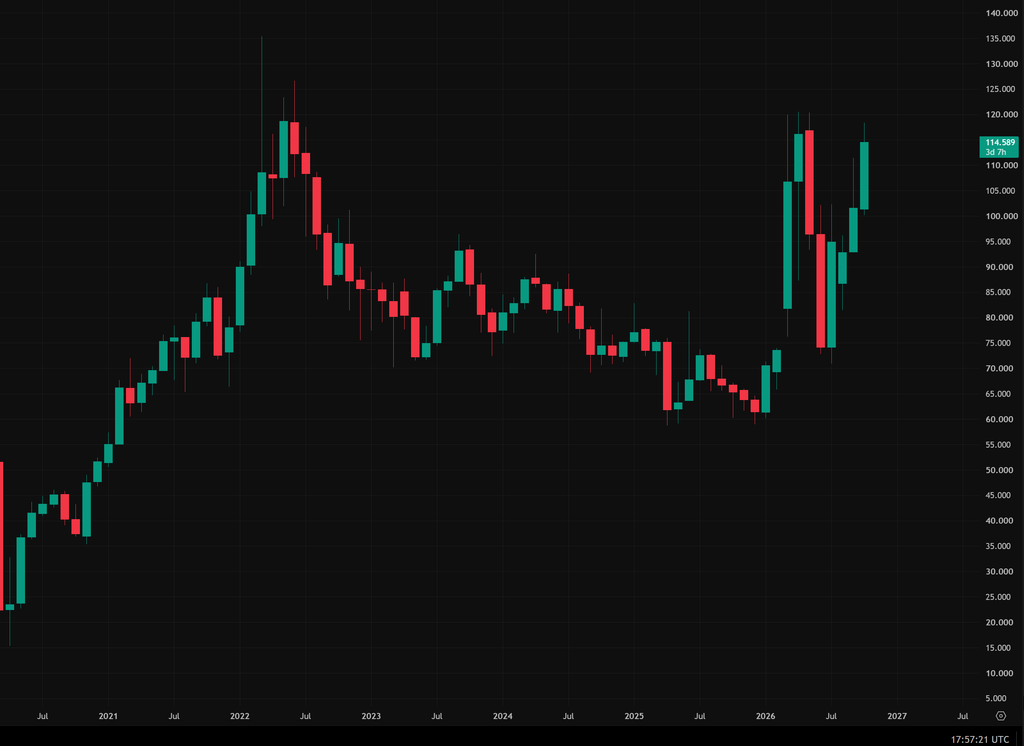
For now, European/UK gas buyers must wait and see the impacts of next week’s US mid-term elections before considering ther best apporoach to securing any remaining open volumes for near-term delivery.
ELECTRICITY & CARBON
Electricity’s Month-Ahead discount versus gas continues to deepen, reflecting increasingly tight fundamentals:
View as table
| Week ending | Gas index | Gas (p/therm) | Power index | Power (£/MWh) |
|---|---|---|---|---|
| 1 Nov 2024 | 100.0 | 98.37 | 100.0 | 89.20 |
| 8 Nov 2024 | 108.4 | 106.63 | 100.6 | 89.77 |
| 15 Nov 2024 | 118.3 | 116.40 | 107.4 | 95.85 |
| 22 Nov 2024 | 118.6 | 116.69 | 106.9 | 95.33 |
| 29 Nov 2024 | 119.0 | 117.09 | 108.3 | 96.60 |
| 6 Dec 2024 | 117.3 | 115.35 | 110.4 | 98.48 |
| 13 Dec 2024 | 104.5 | 102.79 | 100.2 | 89.38 |
| 20 Dec 2024 | 110.6 | 108.84 | 104.8 | 93.51 |
| 27 Dec 2024 | 121.0 | 119.06 | 115.7 | 103.18 |
| 3 Jan 2025 | 126.0 | 123.97 | 115.1 | 102.67 |
| 10 Jan 2025 | 116.0 | 114.07 | 104.4 | 93.10 |
| 17 Jan 2025 | 121.0 | 119.04 | 108.0 | 96.35 |
| 24 Jan 2025 | 126.6 | 124.51 | 119.0 | 106.18 |
| 31 Jan 2025 | 135.4 | 133.23 | 129.2 | 115.25 |
| 7 Feb 2025 | 137.7 | 135.48 | 125.0 | 111.47 |
| 14 Feb 2025 | 124.5 | 122.47 | 113.3 | 101.07 |
| 21 Feb 2025 | 112.3 | 110.51 | 103.1 | 91.99 |
| 28 Feb 2025 | 107.7 | 105.98 | 100.8 | 89.94 |
| 7 Mar 2025 | 98.3 | 96.66 | 91.5 | 81.59 |
| 14 Mar 2025 | 105.6 | 103.85 | 97.6 | 87.05 |
| 21 Mar 2025 | 104.8 | 103.13 | 99.9 | 89.10 |
| 28 Mar 2025 | 99.7 | 98.08 | 96.0 | 85.62 |
| 4 Apr 2025 | 90.0 | 88.49 | 81.9 | 73.05 |
| 11 Apr 2025 | 84.1 | 82.76 | 80.2 | 71.55 |
| 17 Apr 2025 | 88.5 | 87.01 | 84.4 | 75.32 |
| 25 Apr 2025 | 79.1 | 77.77 | 81.2 | 72.43 |
| 2 May 2025 | 81.0 | 79.63 | 82.7 | 73.80 |
| 9 May 2025 | 83.8 | 82.48 | 84.6 | 75.50 |
| 16 May 2025 | 84.8 | 83.42 | 84.6 | 75.42 |
| 23 May 2025 | 88.8 | 87.33 | 87.2 | 77.78 |
| 30 May 2025 | 81.7 | 80.38 | 79.8 | 71.22 |
| 6 Jun 2025 | 86.3 | 84.90 | 85.8 | 76.55 |
| 13 Jun 2025 | 90.8 | 89.27 | 91.5 | 81.65 |
| 20 Jun 2025 | 97.3 | 95.66 | 91.8 | 81.88 |
| 27 Jun 2025 | 77.3 | 76.05 | 80.0 | 71.40 |
| 4 Jul 2025 | 80.4 | 79.12 | 81.1 | 72.38 |
| 11 Jul 2025 | 86.9 | 85.44 | 85.1 | 75.95 |
| 18 Jul 2025 | 81.2 | 79.92 | 81.2 | 72.40 |
| 25 Jul 2025 | 80.0 | 78.65 | 81.9 | 73.05 |
| 1 Aug 2025 | 84.7 | 83.33 | 86.5 | 77.20 |
| 8 Aug 2025 | 80.4 | 79.09 | 86.6 | 77.24 |
| 15 Aug 2025 | 77.5 | 76.23 | 82.4 | 73.52 |
| 22 Aug 2025 | 84.5 | 83.14 | 87.5 | 78.08 |
| 29 Aug 2025 | 79.2 | 77.95 | 83.2 | 74.18 |
| 5 Sep 2025 | 82.1 | 80.75 | 83.4 | 74.43 |
| 12 Sep 2025 | 84.0 | 82.60 | 83.8 | 74.75 |
| 19 Sep 2025 | 83.5 | 82.18 | 85.1 | 75.95 |
| 26 Sep 2025 | 84.7 | 83.32 | 83.4 | 74.38 |
| 3 Oct 2025 | 83.2 | 81.87 | 91.6 | 81.71 |
| 10 Oct 2025 | 84.4 | 83.03 | 93.0 | 82.92 |
| 17 Oct 2025 | 83.1 | 81.75 | 93.2 | 83.12 |
| 24 Oct 2025 | 83.2 | 81.82 | 88.8 | 79.21 |
| 31 Oct 2025 | 82.2 | 80.86 | 89.4 | 79.78 |
| 7 Nov 2025 | 83.3 | 81.90 | 90.6 | 80.79 |
| 14 Nov 2025 | 84.0 | 82.65 | 92.6 | 82.58 |
| 21 Nov 2025 | 80.4 | 79.10 | 91.6 | 81.68 |
| 28 Nov 2025 | 76.5 | 75.24 | 92.2 | 82.24 |
| 5 Dec 2025 | 71.7 | 70.55 | 88.4 | 78.83 |
| 12 Dec 2025 | 73.4 | 72.22 | 91.8 | 81.93 |
| 19 Dec 2025 | 75.1 | 73.91 | 95.9 | 85.58 |
| 26 Dec 2025 | 74.5 | 73.25 | 95.6 | 85.32 |
| 2 Jan 2026 | 74.3 | 73.11 | 93.9 | 83.75 |
| 9 Jan 2026 | 72.0 | 70.84 | 92.8 | 82.83 |
| 16 Jan 2026 | 93.3 | 91.80 | 117.7 | 105.02 |
| 23 Jan 2026 | 99.9 | 98.26 | 119.5 | 106.56 |
| 30 Jan 2026 | 96.8 | 95.20 | 112.3 | 100.17 |
| 6 Feb 2026 | 83.5 | 82.18 | 93.0 | 83.00 |
| 13 Feb 2026 | 76.4 | 75.10 | 83.1 | 74.08 |
| 20 Feb 2026 | 78.1 | 76.82 | 82.8 | 73.90 |
| 27 Feb 2026 | 79.5 | 78.23 | 82.2 | 73.31 |
| 6 Mar 2026 | 136.4 | 134.17 | 113.9 | 101.63 |
| 13 Mar 2026 | 129.3 | 127.19 | 108.5 | 96.79 |
| 20 Mar 2026 | 152.5 | 149.97 | 119.3 | 106.42 |
| 27 Mar 2026 | 138.7 | 136.39 | 111.2 | 99.20 |
| 2 Apr 2026 | 128.0 | 125.95 | 107.5 | 95.90 |
| 10 Apr 2026 | 111.0 | 109.21 | 97.5 | 87.01 |
| 17 Apr 2026 | 97.7 | 96.12 | 92.4 | 82.39 |
| 24 Apr 2026 | 113.1 | 111.23 | 100.9 | 90.01 |
| 1 May 2026 | 112.9 | 111.06 | 104.2 | 92.98 |
| 8 May 2026 | 108.9 | 107.17 | 103.5 | 92.30 |
| 15 May 2026 | 124.9 | 122.82 | 115.0 | 102.62 |
| 22 May 2026 | 119.2 | 117.24 | 112.8 | 100.58 |
| 29 May 2026 | 112.1 | 110.23 | 111.7 | 99.66 |
| 5 Jun 2026 | 119.2 | 117.21 | 115.3 | 102.89 |
| 12 Jun 2026 | 113.8 | 111.95 | 110.6 | 98.70 |
| 19 Jun 2026 | 102.9 | 101.24 | 106.2 | 94.71 |
| 26 Jun 2026 | 99.3 | 97.67 | 101.9 | 90.89 |
| 3 Jul 2026 | 109.9 | 108.14 | 108.5 | 96.76 |
| 10 Jul 2026 | 118.7 | 116.74 | 114.6 | 102.20 |
| 17 Jul 2026 | 141.7 | 139.42 | 129.3 | 115.38 |
| 24 Jul 2026 | 154.6 | 152.04 | 142.6 | 127.18 |
| 31 Jul 2026 | 143.9 | 141.54 | 135.4 | 120.78 |
| 7 Aug 2026 | 138.4 | 136.12 | 129.8 | 115.74 |
| 14 Aug 2026 | 151.9 | 149.40 | 138.6 | 123.62 |
| 21 Aug 2026 | 166.2 | 163.46 | 144.2 | 128.68 |
| 28 Aug 2026 | 165.1 | 162.38 | 146.1 | 130.34 |
| 4 Sep 2026 | 181.9 | 178.90 | 156.8 | 139.89 |
| 11 Sep 2026 | 202.5 | 199.17 | 171.8 | 153.22 |
| 18 Sep 2026 | 200.1 | 196.86 | 171.9 | 153.34 |
| 25 Sep 2026 | 181.5 | 178.49 | 159.2 | 142.05 |
| 2 Oct 2026 | 192.1 | 189.01 | 172.1 | 153.49 |
| 9 Oct 2026 | 206.4 | 202.98 | 182.2 | 162.52 |
| 16 Oct 2026 | 220.6 | 216.98 | 190.0 | 169.45 |
| 23 Oct 2026 | 232.1 | 228.31 | 202.2 | 180.37 |
| 27 Oct 2026 | 240.6 | 236.71 | 214.2 | 191.07 |
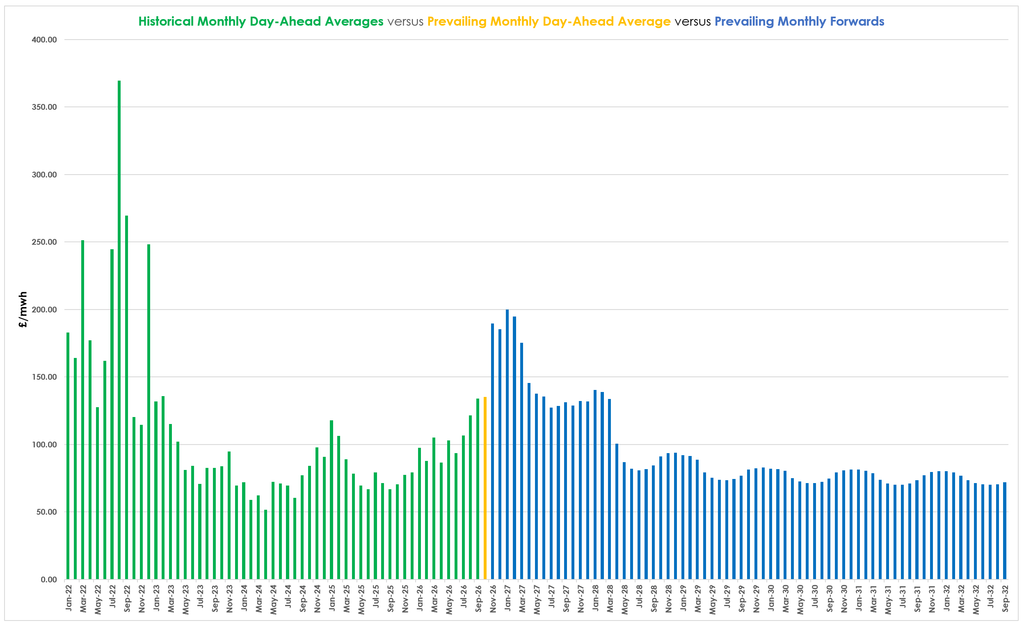
The comparative “cheapness” of electricity is further reflected in October’s Monthly Day-Ahead Average to date – £135.29 /mwh (or 13.529 p/kwh), which remains well-below the offered price of the remaining Winter-26 months – making buyers more likely to leave any open winter volumes to Day-Ahead until further notice:
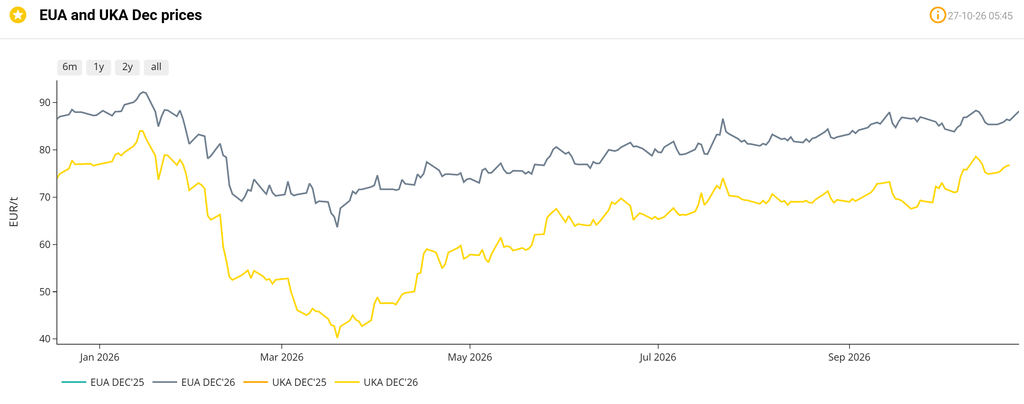
On the Carbon side of things, mid-price Dec-26 UKA delivery sits at at £65.18/tn (and the spot is at mid 64s) – with UK CBAM imminent for Jan ’27, EUA/UKA linkage looks nailed-on (which means, as the significantly less liquid market, UKAs are rising to parity):
Solid value persists further down the curve, with Summer-28 delivery onwards having been significantly less impacted by the current energy crisis over the past 6 months:
View as table
| Season | Six months ago (£/MWh) | Latest close | Change |
|---|---|---|---|
| SUM 27 | 75.04 | 131.35 | +75.0% |
| WIN 27 | 79.50 | 132.41 | +66.6% |
| SUM 28 | 61.69 | 85.43 | +38.5% |
| WIN 28 | 69.91 | 91.25 | +30.5% |
| SUM 29 | 61.71 | 74.41 | +20.6% |
| WIN 29 | 69.52 | 81.13 | +16.7% |