


Prices have nowhere to hide
GAS
As anticipated, in the absence of any mitigating factors, near-term delivery prices are overheating.
The top of the front of the curve is at a 267% premium to the bottom of the back of the curve – or to put it another way, the bottom of the curve is at a 73% discount to the top of the front of the curve!
No matter how you look at it, near-term delivery prices have nowhere to hide amid worsening geopolitical tumult across the globe – the Strait of Hormuz is shut to LNG transit; the mariners transiting the Bab el-Mandeb Strait are proceeding with extreme caution given the conflagration in Riyadh; Russia is pounding Ukrainian energy infrastructure against a backdrop of Trump lifting sanctions on Russian diesel; and the Winter-26 heating season is nearly upon us with only 74% European gas storage in the tanks versus the 5-year average of 87%.
Looking at the offered odds for the US mid-terms at Polymarket (a heavily subscribed US prediction-website), the Democrats have a 91% chance of taking the House of Representatives, a 64% chance of taking the Senate, and a 62% chance of a clean sweep of both houses.
However, for now, Trump’s chaos is at its height, and Europe is feeling the full force of the US Administration’s indifference to the wider world’s plight.
Monthly Day-Ahead Averages for October so far are at 188p/therm (or 6.4p/kwh exc non-gas) – equal to last month’s final number.
Seasonal Forwards are up all the way down the curve versus 1-week/1-month/3-months/6-months ago:
View as table
| Season | Last close (p/therm) | 1 week ago | 1 month ago | 3 months ago | 6 months ago |
|---|---|---|---|---|---|
| SUM 27 | 157.36 | 141.83 | 134.73 | 89.26 | 84.67 |
| WIN 27 | 149.60 | 137.00 | 128.10 | 88.96 | 84.27 |
| SUM 28 | 92.85 | 89.92 | 80.65 | 63.56 | 64.12 |
| WIN 28 | 98.26 | 96.31 | 87.82 | 71.49 | 70.67 |
| SUM 29 | 75.28 | 73.69 | 67.75 | 57.16 | 62.37 |
| WIN 29 | 83.70 | 82.87 | 76.24 | 66.99 | 69.82 |
ELECTRICITY & CARBON
Far-curve Forward prices (available to secure now) are at almost a 60% discount versus Summer-27 delivery – this reflects the intense specualtive froth now pervading the markets:
Electricity Seasonal Forwards remain at a comparative discount to gas (see relative strength chart below), reflecting the increasingly unrealistic premiums being assigned to fossil fuel transit/supply risk as the winter deepens:
View as table
| Week ending | Gas index | Gas (p/therm) | Power index | Power (£/MWh) |
|---|---|---|---|---|
| 18 Oct 2024 | 100.0 | 97.60 | 100.0 | 85.32 |
| 25 Oct 2024 | 112.8 | 110.07 | 112.5 | 96.00 |
| 1 Nov 2024 | 100.8 | 98.37 | 104.5 | 89.20 |
| 8 Nov 2024 | 109.3 | 106.63 | 105.2 | 89.77 |
| 15 Nov 2024 | 119.3 | 116.40 | 112.3 | 95.85 |
| 22 Nov 2024 | 119.6 | 116.69 | 111.7 | 95.33 |
| 29 Nov 2024 | 120.0 | 117.09 | 113.2 | 96.60 |
| 6 Dec 2024 | 118.2 | 115.35 | 115.4 | 98.48 |
| 13 Dec 2024 | 105.3 | 102.79 | 104.7 | 89.38 |
| 20 Dec 2024 | 111.5 | 108.84 | 109.6 | 93.51 |
| 27 Dec 2024 | 122.0 | 119.06 | 120.9 | 103.18 |
| 3 Jan 2025 | 127.0 | 123.97 | 120.3 | 102.67 |
| 10 Jan 2025 | 116.9 | 114.07 | 109.1 | 93.10 |
| 17 Jan 2025 | 122.0 | 119.04 | 112.9 | 96.35 |
| 24 Jan 2025 | 127.6 | 124.51 | 124.4 | 106.18 |
| 31 Jan 2025 | 136.5 | 133.23 | 135.1 | 115.25 |
| 7 Feb 2025 | 138.8 | 135.48 | 130.6 | 111.47 |
| 14 Feb 2025 | 125.5 | 122.47 | 118.5 | 101.07 |
| 21 Feb 2025 | 113.2 | 110.51 | 107.8 | 91.99 |
| 28 Feb 2025 | 108.6 | 105.98 | 105.4 | 89.94 |
| 7 Mar 2025 | 99.0 | 96.66 | 95.6 | 81.59 |
| 14 Mar 2025 | 106.4 | 103.85 | 102.0 | 87.05 |
| 21 Mar 2025 | 105.7 | 103.13 | 104.4 | 89.10 |
| 28 Mar 2025 | 100.5 | 98.08 | 100.4 | 85.62 |
| 4 Apr 2025 | 90.7 | 88.49 | 85.6 | 73.05 |
| 11 Apr 2025 | 84.8 | 82.76 | 83.9 | 71.55 |
| 17 Apr 2025 | 89.1 | 87.01 | 88.3 | 75.32 |
| 25 Apr 2025 | 79.7 | 77.77 | 84.9 | 72.43 |
| 2 May 2025 | 81.6 | 79.63 | 86.5 | 73.80 |
| 9 May 2025 | 84.5 | 82.48 | 88.5 | 75.50 |
| 16 May 2025 | 85.5 | 83.42 | 88.4 | 75.42 |
| 23 May 2025 | 89.5 | 87.33 | 91.2 | 77.78 |
| 30 May 2025 | 82.4 | 80.38 | 83.5 | 71.22 |
| 6 Jun 2025 | 87.0 | 84.90 | 89.7 | 76.55 |
| 13 Jun 2025 | 91.5 | 89.27 | 95.7 | 81.65 |
| 20 Jun 2025 | 98.0 | 95.66 | 96.0 | 81.88 |
| 27 Jun 2025 | 77.9 | 76.05 | 83.7 | 71.40 |
| 4 Jul 2025 | 81.1 | 79.12 | 84.8 | 72.38 |
| 11 Jul 2025 | 87.5 | 85.44 | 89.0 | 75.95 |
| 18 Jul 2025 | 81.9 | 79.92 | 84.9 | 72.40 |
| 25 Jul 2025 | 80.6 | 78.65 | 85.6 | 73.05 |
| 1 Aug 2025 | 85.4 | 83.33 | 90.5 | 77.20 |
| 8 Aug 2025 | 81.0 | 79.09 | 90.5 | 77.24 |
| 15 Aug 2025 | 78.1 | 76.23 | 86.2 | 73.52 |
| 22 Aug 2025 | 85.2 | 83.14 | 91.5 | 78.08 |
| 29 Aug 2025 | 79.9 | 77.95 | 86.9 | 74.18 |
| 5 Sep 2025 | 82.7 | 80.75 | 87.2 | 74.43 |
| 12 Sep 2025 | 84.6 | 82.60 | 87.6 | 74.75 |
| 19 Sep 2025 | 84.2 | 82.18 | 89.0 | 75.95 |
| 26 Sep 2025 | 85.4 | 83.32 | 87.2 | 74.38 |
| 3 Oct 2025 | 83.9 | 81.87 | 95.8 | 81.71 |
| 10 Oct 2025 | 85.1 | 83.03 | 97.2 | 82.92 |
| 17 Oct 2025 | 83.8 | 81.75 | 97.4 | 83.12 |
| 24 Oct 2025 | 83.8 | 81.82 | 92.8 | 79.21 |
| 31 Oct 2025 | 82.8 | 80.86 | 93.5 | 79.78 |
| 7 Nov 2025 | 83.9 | 81.90 | 94.7 | 80.79 |
| 14 Nov 2025 | 84.7 | 82.65 | 96.8 | 82.58 |
| 21 Nov 2025 | 81.0 | 79.10 | 95.7 | 81.68 |
| 28 Nov 2025 | 77.1 | 75.24 | 96.4 | 82.24 |
| 5 Dec 2025 | 72.3 | 70.55 | 92.4 | 78.83 |
| 12 Dec 2025 | 74.0 | 72.22 | 96.0 | 81.93 |
| 19 Dec 2025 | 75.7 | 73.91 | 100.3 | 85.58 |
| 26 Dec 2025 | 75.0 | 73.25 | 100.0 | 85.32 |
| 2 Jan 2026 | 74.9 | 73.11 | 98.2 | 83.75 |
| 9 Jan 2026 | 72.6 | 70.84 | 97.1 | 82.83 |
| 16 Jan 2026 | 94.1 | 91.80 | 123.1 | 105.02 |
| 23 Jan 2026 | 100.7 | 98.26 | 124.9 | 106.56 |
| 30 Jan 2026 | 97.5 | 95.20 | 117.4 | 100.17 |
| 6 Feb 2026 | 84.2 | 82.18 | 97.3 | 83.00 |
| 13 Feb 2026 | 76.9 | 75.10 | 86.8 | 74.08 |
| 20 Feb 2026 | 78.7 | 76.82 | 86.6 | 73.90 |
| 27 Feb 2026 | 80.2 | 78.23 | 85.9 | 73.31 |
| 6 Mar 2026 | 137.5 | 134.17 | 119.1 | 101.63 |
| 13 Mar 2026 | 130.3 | 127.19 | 113.4 | 96.79 |
| 20 Mar 2026 | 153.6 | 149.97 | 124.7 | 106.42 |
| 27 Mar 2026 | 139.7 | 136.39 | 116.3 | 99.20 |
| 2 Apr 2026 | 129.0 | 125.95 | 112.4 | 95.90 |
| 10 Apr 2026 | 111.9 | 109.21 | 102.0 | 87.01 |
| 17 Apr 2026 | 98.5 | 96.12 | 96.6 | 82.39 |
| 24 Apr 2026 | 114.0 | 111.23 | 105.5 | 90.01 |
| 1 May 2026 | 113.8 | 111.06 | 109.0 | 92.98 |
| 8 May 2026 | 109.8 | 107.17 | 108.2 | 92.30 |
| 15 May 2026 | 125.8 | 122.82 | 120.3 | 102.62 |
| 22 May 2026 | 120.1 | 117.24 | 117.9 | 100.58 |
| 29 May 2026 | 112.9 | 110.23 | 116.8 | 99.66 |
| 5 Jun 2026 | 120.1 | 117.21 | 120.6 | 102.89 |
| 12 Jun 2026 | 114.7 | 111.95 | 115.7 | 98.70 |
| 19 Jun 2026 | 103.7 | 101.24 | 111.0 | 94.71 |
| 26 Jun 2026 | 100.1 | 97.67 | 106.5 | 90.89 |
| 3 Jul 2026 | 110.8 | 108.14 | 113.4 | 96.76 |
| 10 Jul 2026 | 119.6 | 116.74 | 119.8 | 102.20 |
| 17 Jul 2026 | 142.8 | 139.42 | 135.2 | 115.38 |
| 24 Jul 2026 | 155.8 | 152.04 | 149.1 | 127.18 |
| 31 Jul 2026 | 145.0 | 141.54 | 141.6 | 120.78 |
| 7 Aug 2026 | 139.5 | 136.12 | 135.7 | 115.74 |
| 14 Aug 2026 | 153.1 | 149.40 | 144.9 | 123.62 |
| 21 Aug 2026 | 167.5 | 163.46 | 150.8 | 128.68 |
| 28 Aug 2026 | 166.4 | 162.38 | 152.8 | 130.34 |
| 4 Sep 2026 | 183.3 | 178.90 | 164.0 | 139.89 |
| 11 Sep 2026 | 204.1 | 199.17 | 179.6 | 153.22 |
| 18 Sep 2026 | 201.7 | 196.86 | 179.7 | 153.34 |
| 25 Sep 2026 | 182.9 | 178.49 | 166.5 | 142.05 |
| 2 Oct 2026 | 193.6 | 189.01 | 179.9 | 153.49 |
| 9 Oct 2026 | 208.0 | 202.98 | 190.5 | 162.52 |
| 13 Oct 2026 | 222.1 | 216.79 | 204.3 | 174.30 |
On the Carbon side of things, mid-price Dec-26 UKA delivery sits at at £66.00/tn (and the spot is at early 65s) – prices are holding onto last week’s gains amid rumours that EUA/UKA linkage looks increasingly likely (which will inevitably mean UKA prices rising to parity):
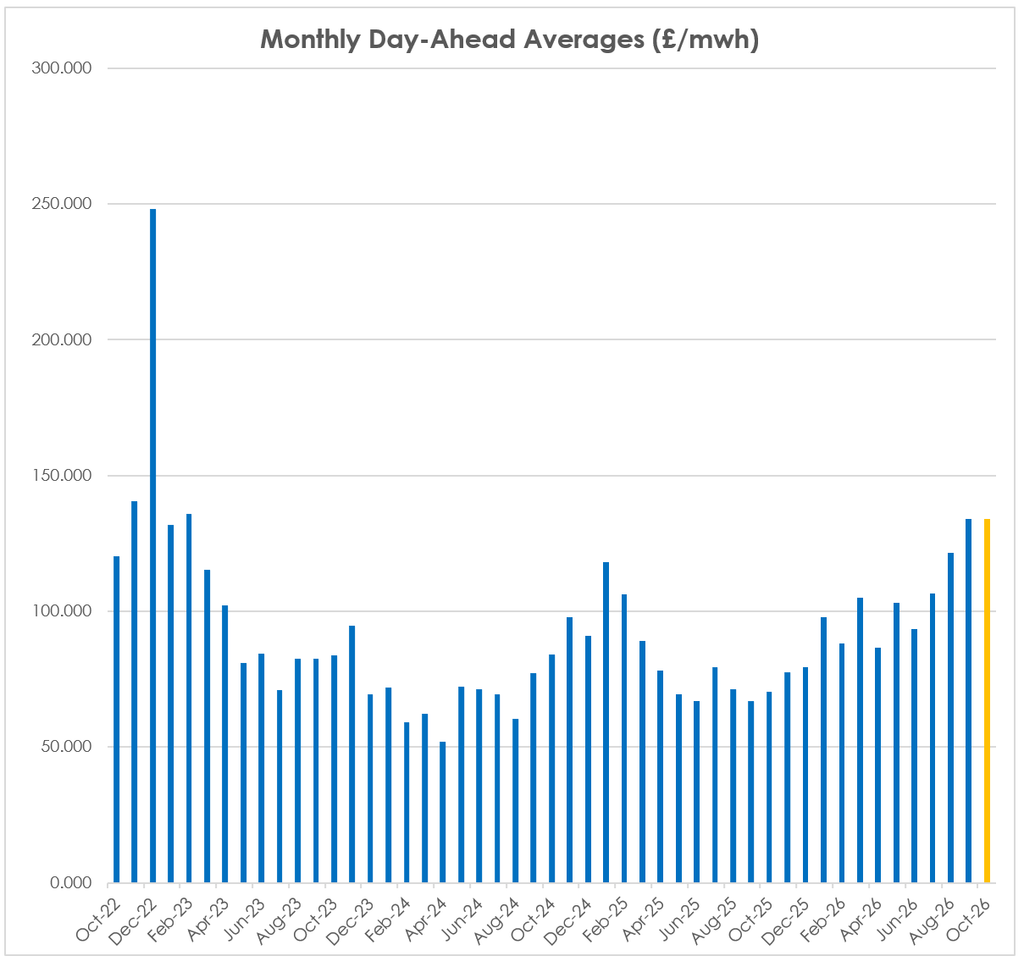
UK electricty Monthly Day-Ahead Averages for October so far have fallen to £134mwh (or 13.4 p/kwh exc non-energy) – equal to last month’s final number: