


Trump tries to calm markets ahead of congressional mid-terms on 3rd Nov
GAS
The US Administration has gone out of their way to reiterate that no miltary action will be taken against Iran before the mid-terms, with Trump citing ongoing and “productive” discussions with Iran.
Markets are little changed at this revelation – instead, forwards are slightly down on the day versus being slightly up on the day yesterday.
In short, range-trading persists and speculators continue to take profits with a view to diving back in at the first hint of bad news.
European storage fullness is at 72% versus the 8-year average of 87%.
Not surprisingly, with the heating season coming into view (beginning November), Seasonal Forwards are meandering northwards as they do at the outset of every winter.
If the Republicans lose heavy in the mid-terms, will we see a drop as we head into Q1 as we did last winter?:
Suffice as to say, for now, prices all the way down the curve are gradually climbing so as to price-in the traditional risk of wintry demand.
But, if the Strait of Hormuz were to re-open, the markets would nonetheless shed significant froth, and speculators would jump out of gas and back into carbon/bonds.
Monthly Day-Ahead Averages for October so far are at 182p/therm (or 6.2p/kwh exc non-gas) – marginally down on last month’s final number of 188p/therm (or 6.4p/kwh exc non-gas).
ELECTRICITY & CARBON
Far-curve Forward prices (available to secure now) are at almost a 60% discount versus Winter-26 delivery – this reflects the market’s underlying hopes that life will return to normal beyond the November mid-terms.
Electricity Seasonal Forwards remain at a comparative discount to gas (see relative strength chart below), this is down to solid renewables outputs limiting gas for power burn over the summer months – though of course this will change in the coming weeks as the days get shorter, and the wind drops (usually around mid-November):
View as table
| Week ending | Gas index | Gas (p/therm) | Power index | Power (£/MWh) |
|---|---|---|---|---|
| 11 Oct 2024 | 100.0 | 98.64 | 100.0 | 85.63 |
| 18 Oct 2024 | 99.0 | 97.60 | 99.6 | 85.32 |
| 25 Oct 2024 | 111.6 | 110.07 | 112.1 | 96.00 |
| 1 Nov 2024 | 99.7 | 98.37 | 104.2 | 89.20 |
| 8 Nov 2024 | 108.1 | 106.63 | 104.8 | 89.77 |
| 15 Nov 2024 | 118.0 | 116.40 | 111.9 | 95.85 |
| 22 Nov 2024 | 118.3 | 116.69 | 111.3 | 95.33 |
| 29 Nov 2024 | 118.7 | 117.09 | 112.8 | 96.60 |
| 6 Dec 2024 | 116.9 | 115.35 | 115.0 | 98.48 |
| 13 Dec 2024 | 104.2 | 102.79 | 104.4 | 89.38 |
| 20 Dec 2024 | 110.3 | 108.84 | 109.2 | 93.51 |
| 27 Dec 2024 | 120.7 | 119.06 | 120.5 | 103.18 |
| 3 Jan 2025 | 125.7 | 123.97 | 119.9 | 102.67 |
| 10 Jan 2025 | 115.6 | 114.07 | 108.7 | 93.10 |
| 17 Jan 2025 | 120.7 | 119.04 | 112.5 | 96.35 |
| 24 Jan 2025 | 126.2 | 124.51 | 124.0 | 106.18 |
| 31 Jan 2025 | 135.1 | 133.23 | 134.6 | 115.25 |
| 7 Feb 2025 | 137.4 | 135.48 | 130.2 | 111.47 |
| 14 Feb 2025 | 124.2 | 122.47 | 118.0 | 101.07 |
| 21 Feb 2025 | 112.0 | 110.51 | 107.4 | 91.99 |
| 28 Feb 2025 | 107.4 | 105.98 | 105.0 | 89.94 |
| 7 Mar 2025 | 98.0 | 96.66 | 95.3 | 81.59 |
| 14 Mar 2025 | 105.3 | 103.85 | 101.7 | 87.05 |
| 21 Mar 2025 | 104.6 | 103.13 | 104.1 | 89.10 |
| 28 Mar 2025 | 99.4 | 98.08 | 100.0 | 85.62 |
| 4 Apr 2025 | 89.7 | 88.49 | 85.3 | 73.05 |
| 11 Apr 2025 | 83.9 | 82.76 | 83.6 | 71.55 |
| 17 Apr 2025 | 88.2 | 87.01 | 88.0 | 75.32 |
| 25 Apr 2025 | 78.8 | 77.77 | 84.6 | 72.43 |
| 2 May 2025 | 80.7 | 79.63 | 86.2 | 73.80 |
| 9 May 2025 | 83.6 | 82.48 | 88.2 | 75.50 |
| 16 May 2025 | 84.6 | 83.42 | 88.1 | 75.42 |
| 23 May 2025 | 88.5 | 87.33 | 90.8 | 77.78 |
| 30 May 2025 | 81.5 | 80.38 | 83.2 | 71.22 |
| 6 Jun 2025 | 86.1 | 84.90 | 89.4 | 76.55 |
| 13 Jun 2025 | 90.5 | 89.27 | 95.4 | 81.65 |
| 20 Jun 2025 | 97.0 | 95.66 | 95.6 | 81.88 |
| 27 Jun 2025 | 77.1 | 76.05 | 83.4 | 71.40 |
| 4 Jul 2025 | 80.2 | 79.12 | 84.5 | 72.38 |
| 11 Jul 2025 | 86.6 | 85.44 | 88.7 | 75.95 |
| 18 Jul 2025 | 81.0 | 79.92 | 84.6 | 72.40 |
| 25 Jul 2025 | 79.7 | 78.65 | 85.3 | 73.05 |
| 1 Aug 2025 | 84.5 | 83.33 | 90.2 | 77.20 |
| 8 Aug 2025 | 80.2 | 79.09 | 90.2 | 77.24 |
| 15 Aug 2025 | 77.3 | 76.23 | 85.9 | 73.52 |
| 22 Aug 2025 | 84.3 | 83.14 | 91.2 | 78.08 |
| 29 Aug 2025 | 79.0 | 77.95 | 86.6 | 74.18 |
| 5 Sep 2025 | 81.9 | 80.75 | 86.9 | 74.43 |
| 12 Sep 2025 | 83.7 | 82.60 | 87.3 | 74.75 |
| 19 Sep 2025 | 83.3 | 82.18 | 88.7 | 75.95 |
| 26 Sep 2025 | 84.5 | 83.32 | 86.9 | 74.38 |
| 3 Oct 2025 | 83.0 | 81.87 | 95.4 | 81.71 |
| 10 Oct 2025 | 84.2 | 83.03 | 96.8 | 82.92 |
| 17 Oct 2025 | 82.9 | 81.75 | 97.1 | 83.12 |
| 24 Oct 2025 | 82.9 | 81.82 | 92.5 | 79.21 |
| 31 Oct 2025 | 82.0 | 80.86 | 93.2 | 79.78 |
| 7 Nov 2025 | 83.0 | 81.90 | 94.4 | 80.79 |
| 14 Nov 2025 | 83.8 | 82.65 | 96.4 | 82.58 |
| 21 Nov 2025 | 80.2 | 79.10 | 95.4 | 81.68 |
| 28 Nov 2025 | 76.3 | 75.24 | 96.1 | 82.24 |
| 5 Dec 2025 | 71.5 | 70.55 | 92.1 | 78.83 |
| 12 Dec 2025 | 73.2 | 72.22 | 95.7 | 81.93 |
| 19 Dec 2025 | 74.9 | 73.91 | 100.0 | 85.58 |
| 26 Dec 2025 | 74.3 | 73.25 | 99.6 | 85.32 |
| 2 Jan 2026 | 74.1 | 73.11 | 97.8 | 83.75 |
| 9 Jan 2026 | 71.8 | 70.84 | 96.7 | 82.83 |
| 16 Jan 2026 | 93.1 | 91.80 | 122.6 | 105.02 |
| 23 Jan 2026 | 99.6 | 98.26 | 124.5 | 106.56 |
| 30 Jan 2026 | 96.5 | 95.20 | 117.0 | 100.17 |
| 6 Feb 2026 | 83.3 | 82.18 | 96.9 | 83.00 |
| 13 Feb 2026 | 76.1 | 75.10 | 86.5 | 74.08 |
| 20 Feb 2026 | 77.9 | 76.82 | 86.3 | 73.90 |
| 27 Feb 2026 | 79.3 | 78.23 | 85.6 | 73.31 |
| 6 Mar 2026 | 136.0 | 134.17 | 118.7 | 101.63 |
| 13 Mar 2026 | 129.0 | 127.19 | 113.0 | 96.79 |
| 20 Mar 2026 | 152.0 | 149.97 | 124.3 | 106.42 |
| 27 Mar 2026 | 138.3 | 136.39 | 115.9 | 99.20 |
| 2 Apr 2026 | 127.7 | 125.95 | 112.0 | 95.90 |
| 10 Apr 2026 | 110.7 | 109.21 | 101.6 | 87.01 |
| 17 Apr 2026 | 97.4 | 96.12 | 96.2 | 82.39 |
| 24 Apr 2026 | 112.8 | 111.23 | 105.1 | 90.01 |
| 1 May 2026 | 112.6 | 111.06 | 108.6 | 92.98 |
| 8 May 2026 | 108.6 | 107.17 | 107.8 | 92.30 |
| 15 May 2026 | 124.5 | 122.82 | 119.8 | 102.62 |
| 22 May 2026 | 118.9 | 117.24 | 117.5 | 100.58 |
| 29 May 2026 | 111.8 | 110.23 | 116.4 | 99.66 |
| 5 Jun 2026 | 118.8 | 117.21 | 120.2 | 102.89 |
| 12 Jun 2026 | 113.5 | 111.95 | 115.3 | 98.70 |
| 19 Jun 2026 | 102.6 | 101.24 | 110.6 | 94.71 |
| 26 Jun 2026 | 99.0 | 97.67 | 106.2 | 90.89 |
| 3 Jul 2026 | 109.6 | 108.14 | 113.0 | 96.76 |
| 10 Jul 2026 | 118.4 | 116.74 | 119.4 | 102.20 |
| 17 Jul 2026 | 141.3 | 139.42 | 134.8 | 115.38 |
| 24 Jul 2026 | 154.1 | 152.04 | 148.5 | 127.18 |
| 31 Jul 2026 | 143.5 | 141.54 | 141.1 | 120.78 |
| 7 Aug 2026 | 138.0 | 136.12 | 135.2 | 115.74 |
| 14 Aug 2026 | 151.5 | 149.40 | 144.4 | 123.62 |
| 21 Aug 2026 | 165.7 | 163.46 | 150.3 | 128.68 |
| 28 Aug 2026 | 164.6 | 162.38 | 152.2 | 130.34 |
| 4 Sep 2026 | 181.4 | 178.90 | 163.4 | 139.89 |
| 11 Sep 2026 | 201.9 | 199.17 | 178.9 | 153.22 |
| 18 Sep 2026 | 199.6 | 196.86 | 179.1 | 153.34 |
| 25 Sep 2026 | 181.0 | 178.49 | 165.9 | 142.05 |
| 2 Oct 2026 | 191.6 | 189.01 | 179.3 | 153.49 |
| 9 Oct 2026 | 205.8 | 202.98 | 189.8 | 162.52 |
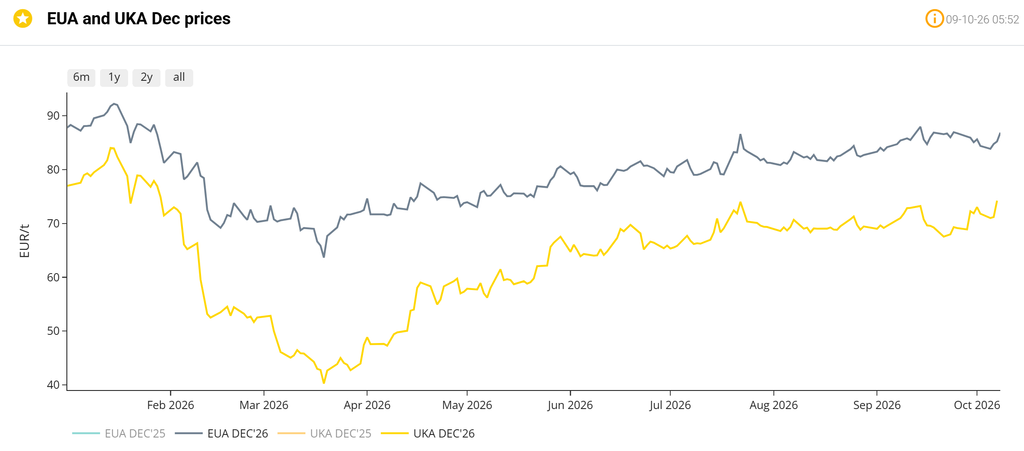
On the Carbon side of things, mid-price Dec-26 UKA delivery sits at at £64.62/tn (and the spot is at mid 63s) – prices are significantly up this week amid rumours that EUA/UKA linkage looks increasingly likely (which will inevitably mean UKA prices rising to parity):
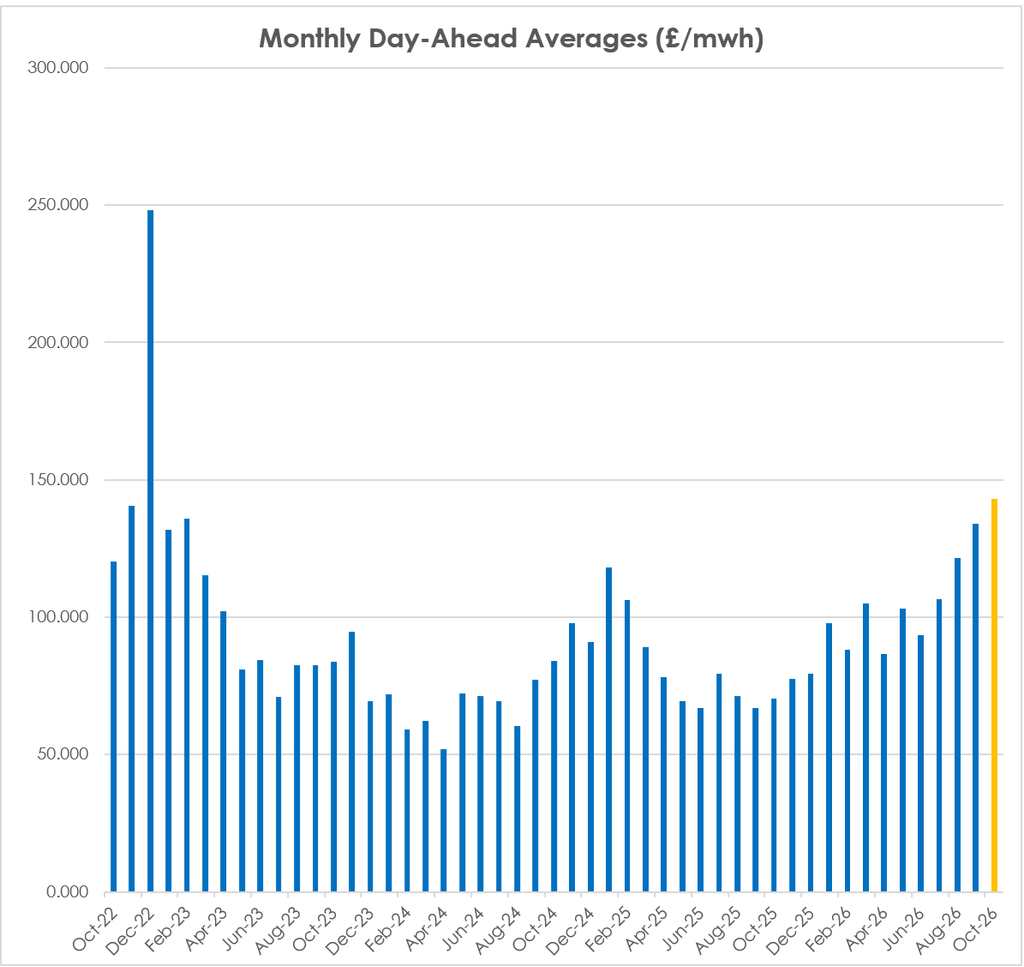
UK electricty Monthly Day-Ahead Averages for October so far are at £143/mwh (or 14.3 p/kwh exc non-energy), up from last month’s final number of £134/mwh (or 13.4p/kwh exc non-energy):