



Fri, 7th Nov ’25
GAS
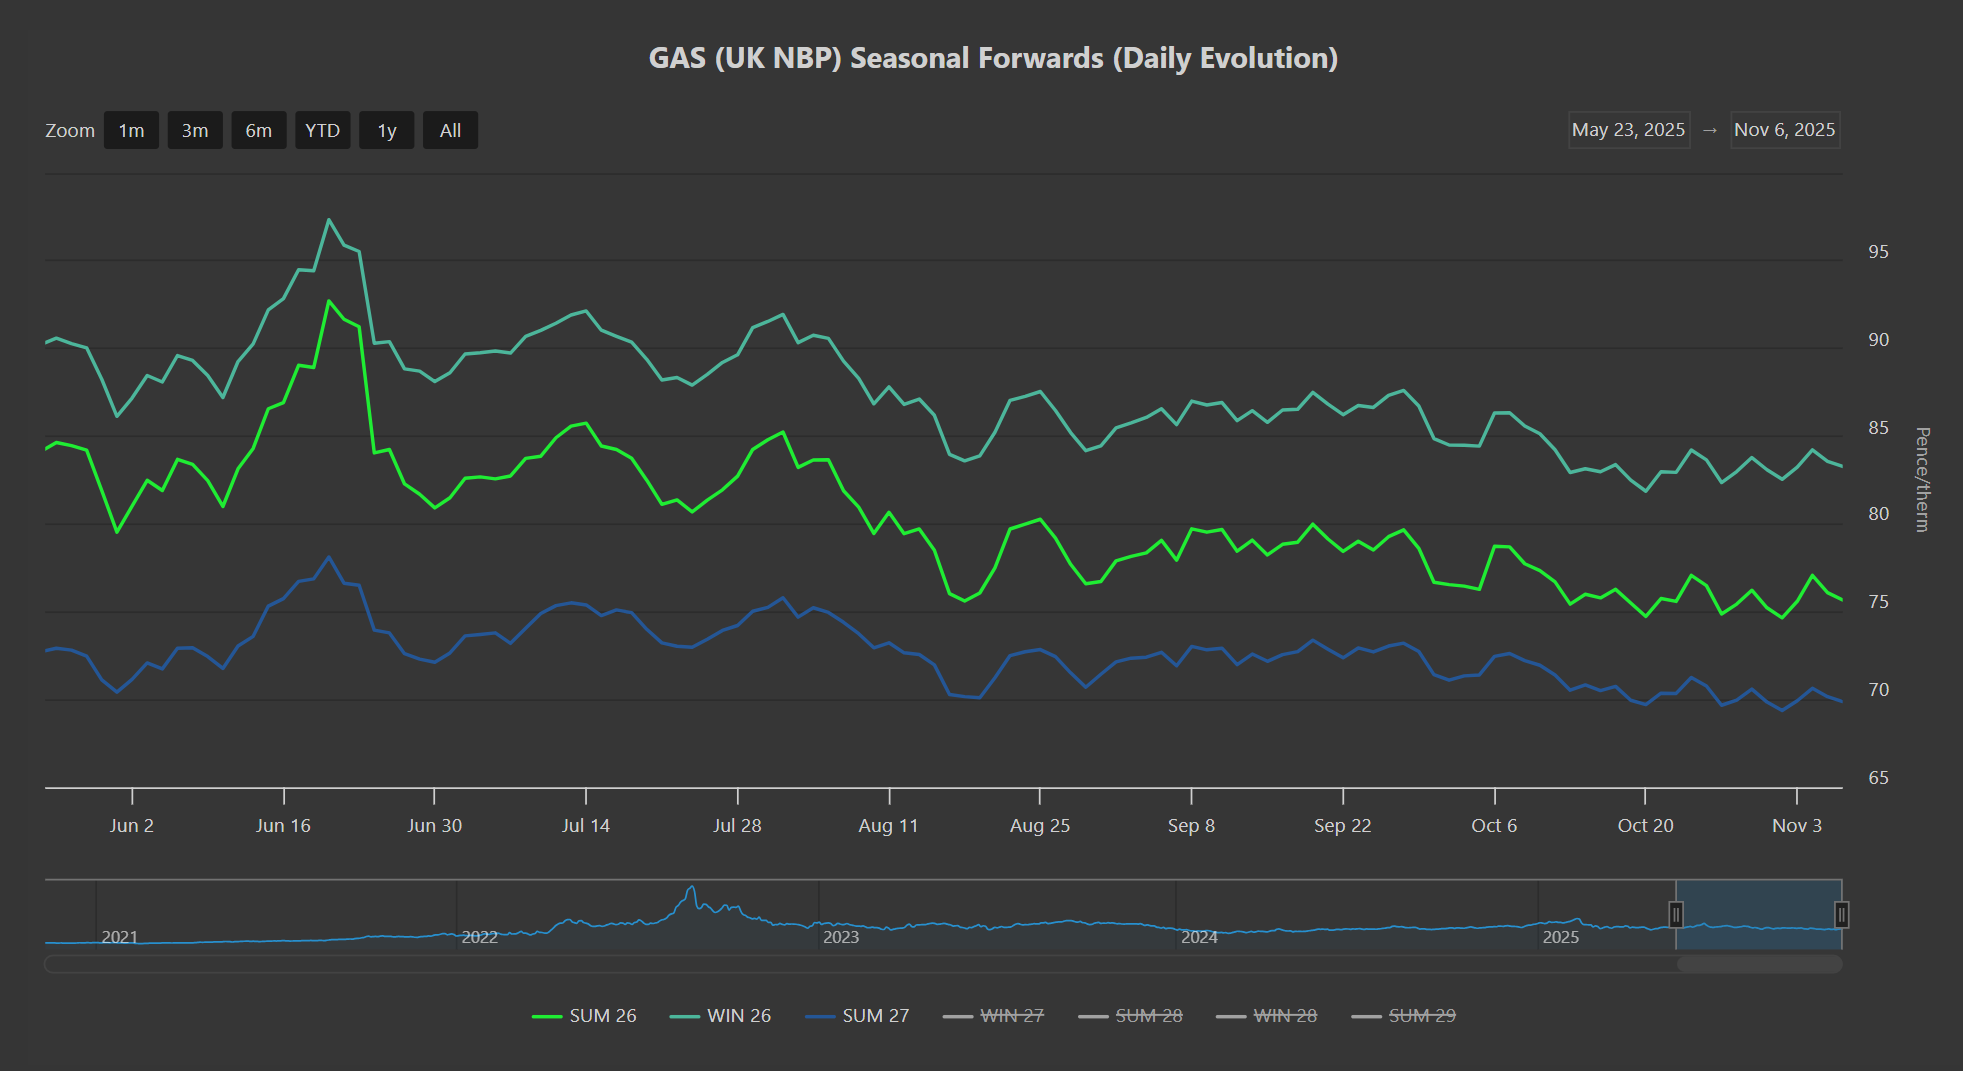
- Overcooked fear (about replenishing European gas storage in time for the Winter-25 heating season), peaked in Jun ’25 (please see chart below), but abated thereafter once it became clear that supply/demand dynamics would support sufficient storage injections throughout Summer-25.
- Since the Jun ’25 highs, the front 3-Seasons (Summer-26/Winter-26/Summer-27) have traded within a tight 12% range.
- Since Winter-25 began on 1st Oct’25, the front 3-Seasons have all traded sideways in a 3.5% range – reflecting a very balanced market, and an underlying confidence amongst market participants that European storage fullness (now at 83% versus the 7-year average at 89%) should be enough to get us through the heating season without too many problems.
- On the weather side of things, temperatures are forecast to remain above seasonal norms over the coming weeks, delaying the bullish impacts of the heating season.
- On the supply side, plentiful LNG arrivals and send-out, coupled with Norwegian pipeline flows comfortably above the 10-day moving average, are also helping to keep the winter bulls at bay.
- Notably, the European LNG imports 30-day moving average has been at was at 230k tonnes per day this week – 54% higher than the five-year seasonal average!
- As cited in previous bulletins, this “glut” of LNG into Europe can be attributed to new facilities (Russia’s Arctic 2 terminal and LNG Canada) servicing Asia’s requirement more specifically, whilst US supply is all but bound for Europe/the UK – so additional capacity is easing global supply/demand pressures as well as mitigating any bidding wars for cargoes (keeping price low).
- Monthly Day-Ahead averages for November so far are at 75p/therm (or 2.56p/kwh exc. non-gas).
- The heating season will undoubtedly arrive eventually, though speaking personally, we still have cosmos blooming in the garden!
- As such, and given mid-range weather forecasts, it’s anyone’s guess when the heating season will begin in earnest (making for a shorter withdrawal period, another bearish driver).
ELECTRICITY & CARBON
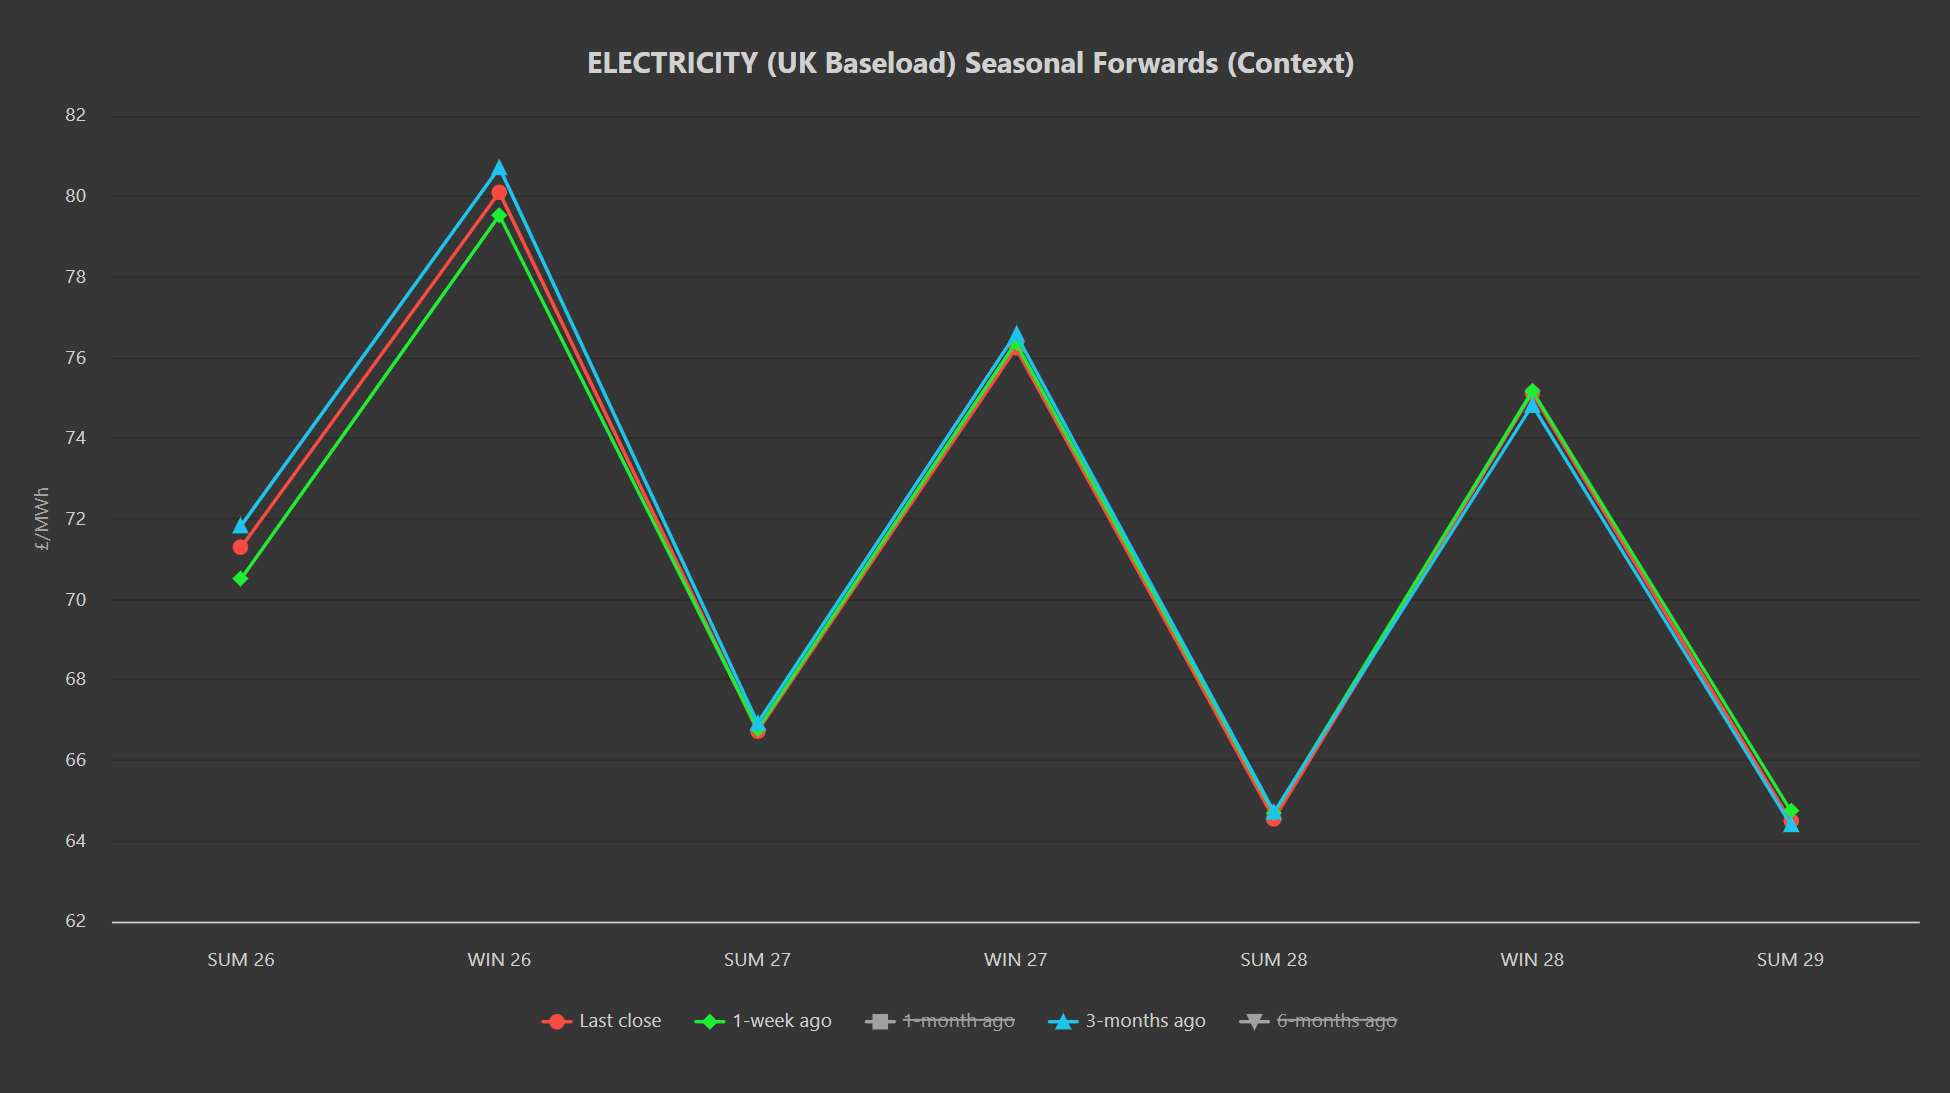
- Electricity prices are mirroring gas moves.
- Looking at the chart below then, we’ve removed the 1-month ago and 6-months ago lines revealing how Seasonal Forwards 3-months ago are all but identical to Last Close and/or 1-month ago.
- This reflects of course how stable electricity Forward prices have been since mid-summer.
- On the Carbon side of things, UKAs are increasingly correlated to EUAs (following the “common understanding” reached between the UK/Europe to link emissions markets at the UK-EU summit in London on 19th May).
- Whilst UKAs are retracing back to £55/tn following Monday’s speculative bull rally, they’re doing so at quite a clip – reflecting the reality that whilst speculators can drive the market up, it’s difficult for them to keep it there.
- Today’s UK electricity generation mix is bullish in nature given patchy wind outputs – specifically, renewables are contributing 21%, thermal at 48% (gas and coal) and low carbon at 18% (nuclear and imports).
- Monthly Day-Ahead averages for November so far are at £68/mwh (or 6.8p/kwh exc. non-energy).